Animation above shows spectrum of as p varies, for a matrix A with a curious property.
p
A
What makes this matrix curious is that its trace is almost equal to its squared Frobenius norm.
Adding up diagonal entries is the same as adding up squares of all entries.
Adding up diagonal entries is the same as adding up squares of all entries.
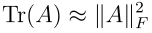
This relation extends to powers of A in the following way
1. Write Frobenius norm in terms of , singular values of A
1. Write Frobenius norm in terms of
σ
i
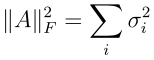
2. Observe the following
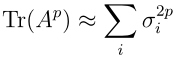
Eigenvalues and squared singular values are quite different.
They remain different when we raise them to a power p
Yet the difference disappears when we add them up.
For p=1 equality is proven to hold in expectation by user1551 in the following post
p>1 is open. Discussion is on mathoverflow
Matrix A is defined as a product of d random projections
They remain different when we raise them to a power p
Yet the difference disappears when we add them up.
For p=1 equality is proven to hold in expectation by user1551 in the following post
p>1 is open. Discussion is on mathoverflow
Matrix A is defined as a product of d random projections

Naive way of computing it is 100x slower than it should be, Henrik and Michael give tricks to compute efficiently here
ClearAll["Global`*"];d=200;(*dimensions*)maxP=20;(*largestpower*)numSteps=80;(*numberofframes*)genFrames:=(SeedRandom[1];SF=StringForm;nf[vals_]:=NumberForm[N@vals,{3,3}];isotropic=Normalize/@RandomVariate[NormalDistribution[],{d,d}];A=N@IdentityMatrix[d];Do[LinearAlgebra`LAPACK`LARF["R",v,1.,A],{v,isotropic}];map2[x_]:=Map[ReIm,x,{2}];pvals=Range[1,maxP,(maxP-1)/numSteps];xs0=Eigenvalues[A];xs=map2@Table[,{p,pvals}];drawTrajectories[s_]:=Graphics[{Opacity[.05]}~Join~(Line/@Transpose[xs][[All,;;s,All]])];{xmin,xmax}=MinMax[First[xs][[All,1]]];{ymin,ymax}=MinMax[First[xs][[All,2]]];pr={{xmin,xmax},{ymin,ymax}};combinedTrajectoryPlot[s_]:=Show[ListPlot[xs[[s]],PlotStyle->{Red}],drawTrajectories[s],PlotRange->pr,AspectRatio->1,Axes->None,PlotLabel->SF["λ(), p=``",nf@pvals[[s]]]];Table[combinedTrajectoryPlot[k],{k,1,Length@pvals}]);frames=genFrames;ListAnimate[frames]
p
xs0
p
A
Higher duration plot export
Higher duration plot export
In[]:=
d=200;(*dimensions*)maxP=20;(*largestpower*)numSteps=200;(*numberofframes*)frames=genFrames;SetDirectory[NotebookDirectory[]];Export["powersums-animate.gif",frames,"DisplayDurations"->1/50]
Export["powersums-animate.mp4",frames,"DisplayDurations"->1/50]
CITE THIS NOTEBOOK
CITE THIS NOTEBOOK
A matrix with curious property: near-equality of trace and squared Frobenius norm
by Yaroslav Bulatov
Wolfram Community, STAFF PICKS, December 28, 2024
https://community.wolfram.com/groups/-/m/t/3345575
by Yaroslav Bulatov
Wolfram Community, STAFF PICKS, December 28, 2024
https://community.wolfram.com/groups/-/m/t/3345575