ConchoidSurface::usage="The definition of a conchoid surface is:[u, v] = r[u, v] ± k , P is the pole, k distance and r[u, v] the base surface.In this notebook we will obtain the conchoid surface of the plane z = 1, with the distance k = 3 and as pole P the origin.Reference: Peternell, M. et al.Conchoid surfaces of rational ruled surfaces. Vienna University of Technology; Personal. ";
r
c
r[u,v]-P
r[u,v]-P
Development:
Using the unit sphere, the parametric equations of the plane z = 1:
1
Sin[v]
Graph:
In[]:=
SwatchLegend[{Orange,Blue,Yellow},{"Positive conchoid surface","Negative conchoid surface","Base surface z = 1"}]Showr[u_,v_]:={Cos[u]Cot[v],Sin[u]Cot[v],1};k=3;P={0,0,0};r1[u_,v_]:=r[u,v]+k;r2[u_,v_]:=r[u,v]-k;{ParametricPlot3D[{r1[u,v],r2[u,v]},{u,0,2π},{v,0,2π},PerformanceGoal"Quality",PlotPoints60],ContourPlot3D[z==1,{x,-5,5},{y,-5,5},{z,-1,1},MeshFalse,ContourStyle->{Yellow,Opacity[0.3]}]},AxesLabel->(Style[#,15,Blue]&/@{"X","Y","Z"}),AxesOrigin{0,0,0},AxesTrue,BoxedFalse,BoxRatiosAutomatic,PlotLabelStyle[Framed["Conchoid surface of the plane z = 1"],16,Blue,BackgroundYellow],PlotRange{{-5,5},{-5,5},{-2,4}},ViewPoint{1.3,-2.4,0.3},ImageSize900
r[u,v]-P
Norm[r[u,v]]
r[u,v]-P
Norm[r[u,v]]
Out[]=


Out[]=

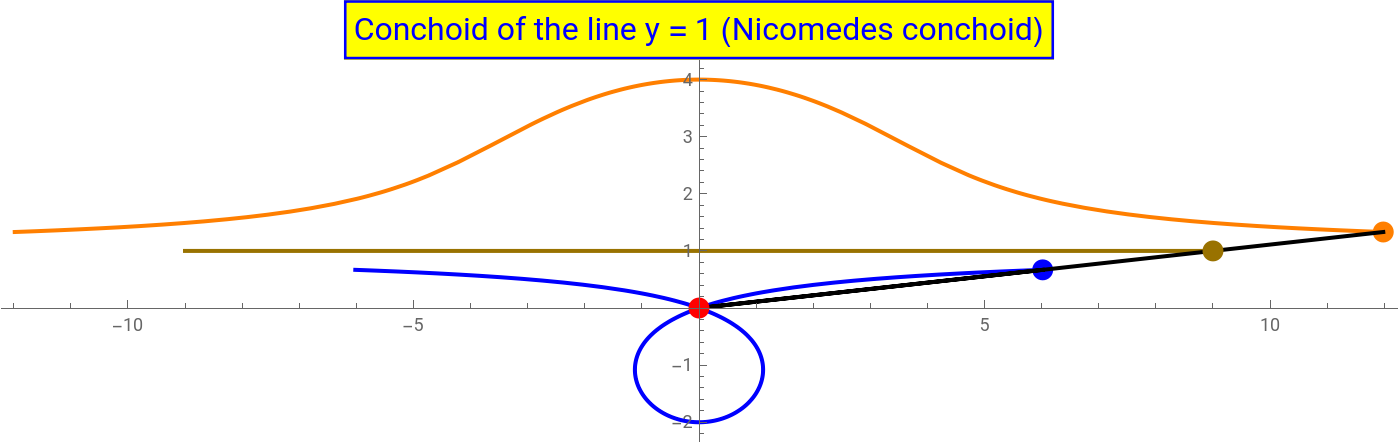
Explanation in 2D:
In[]:=
SwatchLegend[{Orange,Blue,DarkYellow,Red,Black},{"Positive Conchoid","Negative Conchoid","Original function","Pole","Generatrix line"}]Manipulatef[t_]:=t;g[t_]:=1;=0;=0;k=3;[t_]:=f[t]++,g[t]++;[t_]:=f[t]-+,g[t]-+;Show[{ParametricPlot[[t],{t,-9,t1},PlotStyle{Orange,Thick},PerformanceGoal->"Quality"],ParametricPlot[[t],{t,-9,t1},PlotStyle{Blue,Thick},PerformanceGoal->"Quality"],ParametricPlot[{f[t],g[t]},{t,-9,9},PlotStyle{DarkYellow,Thick}],Graphics[{Orange,PointSize[0.015],Point[[t1]]}],Graphics[{Blue,PointSize[0.015],Point[[t1]]}],Graphics[{Black,Thick,Line[{[t1],{,},[t1]}]}],Graphics[{Red,PointSize[0.015],Point[{,}]}],Graphics[{DarkYellow,PointSize[0.015],Point[{f[t1],g[t1]}]}]},AxesTrue,AxesOrigin{0,0},AspectRatioAutomatic,ImageSize700,PlotRange{{-11,11},{-2,4}},PlotLabelStyle[Framed["Conchoid of the line y = 1 (Nicomedes conchoid)"],16,Blue,BackgroundYellow]],{{t1,-9+0.00002,"Value (t1)"},-9+0.00001,9,0.00001},ControlPlacement->Top
x
0
y
0
ζ
+
k(f[t]-)
x
0
2
(f[t]-)
x
0
2
(g[t]-)
y
0
k(g[t]-)
y
0
2
(f[t]-)
x
0
2
(g[t]-)
y
0
ζ
-
k(f[t]-)
x
0
2
(f[t]-)
x
0
2
(g[t]-)
y
0
k(g[t]-)
y
0
2
(f[t]-)
x
0
2
(g[t]-)
y
0
ζ
+
ζ
-
ζ
+
ζ
-
ζ
-
x
0
y
0
ζ
+
x
0
y
0
Out[]=


Out[]=