I briefly explore some viz for daily COVID19 cases (weakly-averaged time series) across US counties. The distribution of data (as, e.g., histogram) in time show an interesting trend toward heavy tail distributions, that could be used for developing some predictive measures (which I will explore in another essay).
Clear the cached data, if any:
In[]:=
DeleteObject[ResourceObject["Epidemic Data for Novel Coronavirus COVID-19"]]
Get data from Wolfram Function Repository:
In[]:=
ds0=ResourceData["Epidemic Data for Novel Coronavirus COVID-19","USCounties"];
Column tags:
In[]:=
ds0[1]//Keys//Normal
Out[]=
{State,County,GeoPosition,ConfirmedCases,Deaths}
A peek into dataset:
In[]:=
ds0[{1,2000}]
Out[]=

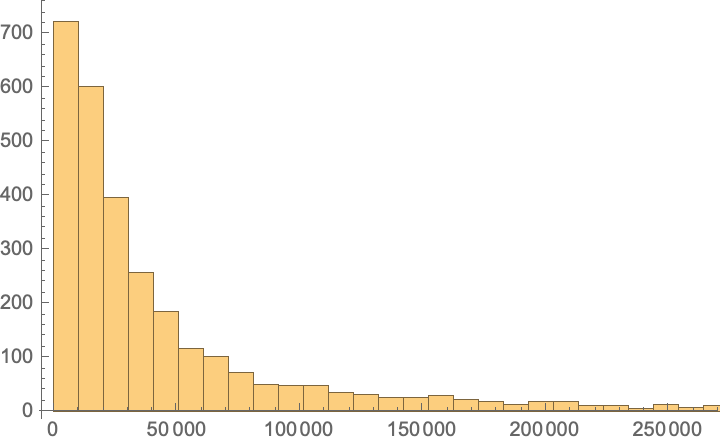
Histogram of US counties populations:
In[]:=
ds0[Histogram@DeleteMissing@EntityValue[#,"Population"]&,"County"]
Out[]=
1/4, 1/2, and 3/4 of US counties population data:
In[]:=
ds0[Quantile[DeleteMissing@EntityValue[#,"Population"],{.25,.5,.75}]&,"County"]
Out[]=
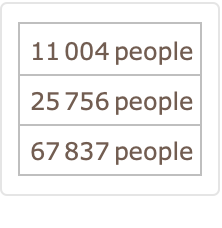
Although most viz calculate the COVID19 confirmed cases per 10,000 or 100,000 inhabitants, I think it is more convenient to consider a number close to 1/2 quantile. So I shall take cases per 30k inhabitants.
Return a list of {{counties},{ weekly averaged timeseries of cases}}:
In[]:=
dt=ds0All,#County,&[Select[FreeQ[_Missing]]]//Normal//Transpose;
MovingAverage[#ConfirmedCases,]
QuantityMagnitude[#County["Population"]]/30000
dates in dataset
In[]:=
dates=dt〚2,1〛["Dates"];
In[]:=
MinMax[dates]
Out[]=
,
How many days of data?
In[]:=
DateRange@@%//Length
Out[]=
294
How many months?
In[]:=
DateRange[Sequence@@%%,"Month"]//Length
Out[]=
10
Yike! 10 months of tracking COVID19 data!!
Put all values for all counties into a TemporalData (why? b/c it will be easier to call data later, you will see soon), then map Differences to get daily cases:
In[]:=
dailyCases=Differences@TemporalData[#["Values"]&/@dt〚2〛,{dates}];
Now using dailyCases[“SliceData”,date] we can call the covid19 daily cases for all US counties. Beauty of functional programming in WL!
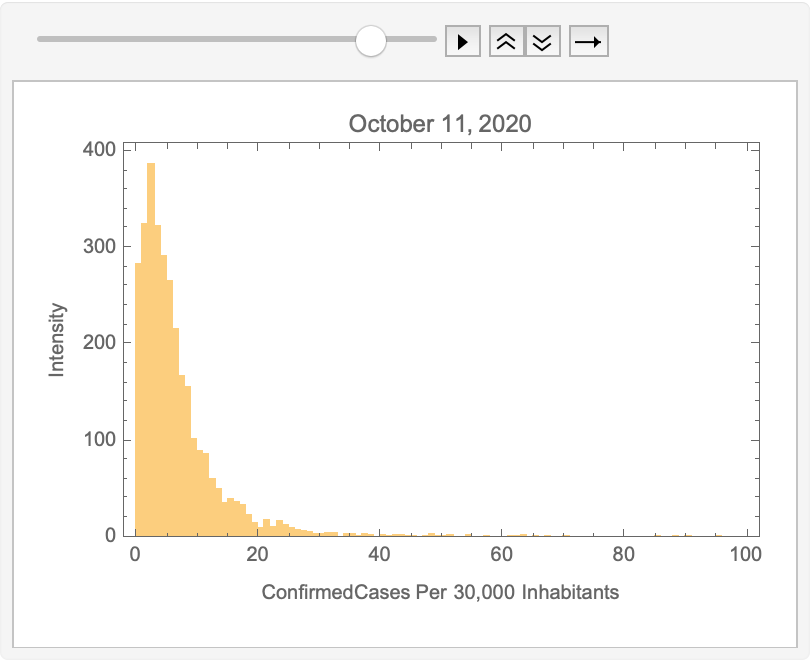
For all dates, get the daily cases for all counties and return a histogram:
In[]:=
list=Histogram[dailyCases["SliceData",#],{0,100,1},"Intensity",(*PlotRange{0,.3},*)FrameTrue,FrameLabel{"ConfirmedCases Per 30,000 Inhabitants","Intensity"},PlotLabelDateString[#,{"MonthName"," ","Day",", ","Year"}],ImageSizeMedium]&/@dates〚2;;〛;
Find the underlying distribution from the data:
In[]:=
dist=FindDistribution/@(dailyCases["SliceData",#]&/@dates〚2;;〛);
In[]:=
Flatten[dist]/.MixtureDistribution[_,{x_,y_}](Head/@{x,y})//Flatten//Counts//ReverseSort
Out[]=
NormalDistribution205,CauchyDistribution174,LogNormalDistribution75,WaringYuleDistribution[1571.5]41,LogisticDistribution36,LaplaceDistribution2,FrechetDistribution[3.21159,16.3345,-10.5651]1,FrechetDistribution[3.21564,15.724,-10.213]1,ExtremeValueDistribution[2.83812,3.24127]1,PoissonDistribution[0.0031837]1,PoissonDistribution[0.00222859]1,PoissonDistribution[0.00159185]1
Animate viz of histograms:
In[]:=
ListAnimate[list,10,AnimationRepetitions1]
Out[]=
Geo viz
Geo viz
Now lets visualize it over county polygons. I am sure you have seen such a GIF many times, even I made one some months ago, but let’s explore it.
Define colors and bins used in the visualization.
In[]:=
colors=(*Blend[{Green,Red},#]*)Blend,,#&/@Range[0,1,1/11];bins=Range[0,50,5];cfunc[x_]:=Which@@Riffle[Join[x≤#&/@bins,{x>Last[bins]}],colors];


Define the legend used based on colors and bins:
legend=BarLegend[{colors,MinMax[bins]},bins,LegendLayout"Column",LegendLabel"Daily Cases per 30k ppl",LegendMarkerSize200]
Out[]=

Geo-visualize counties with colors proportional to cases per 30k inhabitant:
In[]:=
geoViz[day_]:=Module{data,continentalCounties,alaskaCounties,hawaiiCounties},data=Transpose[{dailyCases["SliceData",day],dt〚1〛}];continentalCounties=Selectdata,MemberQFlatten,#2&;alaskaCounties=Selectdata,MemberQEntityList@,#2&;hawaiiCounties=Selectdata,MemberQEntityList@,#2&;GeoGraphics[{{GeoStyling[FaceForm[cfunc[#1]],EdgeForm[]],Polygon[#2]}&@@@continentalCounties,Inset[GeoGraphics[{{GeoStyling[FaceForm[cfunc[#1]],EdgeForm[]],Polygon[#2]}&@@@alaskaCounties},GeoBackgroundNone],Scaled[{0.0,0.0}],Scaled[{0.2,0.2}],Scaled[{0.5,0.5}]],Inset[GeoGraphics[{{GeoStyling[FaceForm[cfunc[#1]],EdgeForm[]],Polygon[#2]}&@@@hawaiiCounties},GeoBackgroundNone],Scaled[{0.3,0.1}],{Center,Center},Scaled[{0.2,0.2}]],Inset[legend,Scaled[{.15,1}],{Right,Top},Automatic]},GeoBackgroundNone,ImageSize600,PlotLabelDateString[day,{"MonthName"," ","Day",", ","Year"}]]

Geo-viz 4 random days:
Sorry, next step is kind of time-consuming
GIF
GIF
Acknowledgment
Acknowledgment
Diego Zviovich has developed a very interesting GIF on COVID19 spread across US. For plotting lower 48 US states with Alaska and Hawaii, I borrowed some ideas from Arnoud Buzing (WRI).