Hi, All!
I use Wolfram Mathematica 12.2. Let's define a simple harmonic signal with frequency ν = 0.25:
In[]:=
n=100;data=Cos[2πRange[0,n-1]*0.25]//N;
and look at its Fourier transform plot:
In[]:=
pdg=Periodogram[data,PlotRangeAll,ScalingFunctions{"Linear","Linear"}]
Out[]=
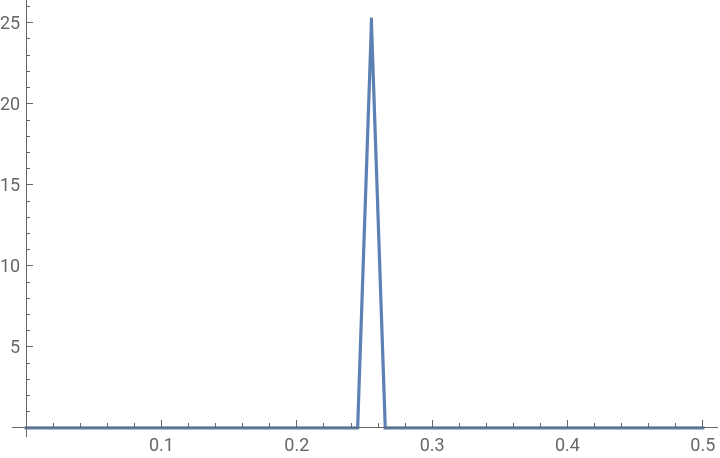
We can see that the frequency is a bit shifted from 0.25. To make sure of this, we can extract the list of the plot data:
In[]:=
pdg$data=pdg[[Sequence@@Join[Drop[First@Position[pdg,Line],-1],{1}]]]
Out[]=
{{0.,1.42843×},{0.0102041,2.35928×},{0.0204082,9.32647×},{0.0306122,2.24275×},{0.0408163,1.27991×},{0.0510204,1.41714×},{0.0612245,2.15971×},{0.0714286,2.17696×},{0.0816327,2.15905×},{0.0918367,1.59281×},{0.102041,7.97499×},{0.112245,1.97964×},{0.122449,2.2329×},{0.132653,9.28213×},{0.142857,1.88923×},{0.153061,5.71395×},{0.163265,3.40235×},{0.173469,9.44819×},{0.183673,2.68647×},{0.193878,1.02784×},{0.204082,7.37235×},{0.214286,1.22552×},{0.22449,3.68557×},{0.234694,6.96648×},{0.244898,1.63495×},{0.255102,25.},{0.265306,1.63495×},{0.27551,7.29758×},{0.285714,3.68557×},{0.295918,1.23432×},{0.306122,7.37235×},{0.316327,1.05725×},{0.326531,2.68647×},{0.336735,1.47065×},{0.346939,3.40235×},{0.357143,1.10163×},{0.367347,1.88923×},{0.377551,8.59021×},{0.387755,2.2329×},{0.397959,1.98678×},{0.408163,7.97499×},{0.418367,1.57619×},{0.428571,2.15905×},{0.438776,2.2782×},{0.44898,2.15971×},{0.459184,1.32591×},{0.469388,1.27991×},{0.479592,2.00524×},{0.489796,9.32647×},{0.5,2.37349×}}
-29
10
-29
10
-30
10
-30
10
-29
10
-29
10
-29
10
-29
10
-29
10
-29
10
-30
10
-29
10
-29
10
-30
10
-29
10
-31
10
-30
10
-31
10
-30
10
-29
10
-30
10
-29
10
-30
10
-30
10
-29
10
-29
10
-30
10
-30
10
-29
10
-30
10
-29
10
-30
10
-30
10
-30
10
-30
10
-29
10
-30
10
-29
10
-29
10
-30
10
-29
10
-29
10
-29
10
-29
10
-29
10
-29
10
-30
10
-30
10
-29
10
The peak in the spectrum is at
In[]:=
ν$wrong=First@pdg$data[[First@Flatten@Position[pdg$data,Max[pdg$data[[All,2]]]]]]
Out[]=
0.255102
We also see that the frequencies in Periodogram are multiples of
In[]:=
ν0$wrong=pdg$data[[2,1]]
Out[]=
0.0102041
that corresponds to the length of the array
In[]:=
n$wrong=1/ν0$wrong
Out[]=
98.
rather than n
In[]:=
n
Out[]=
100
Is it a bug of Periodogram or some feature that I cannot understand?
WBR,
Vladimir.
WBR,
Vladimir.