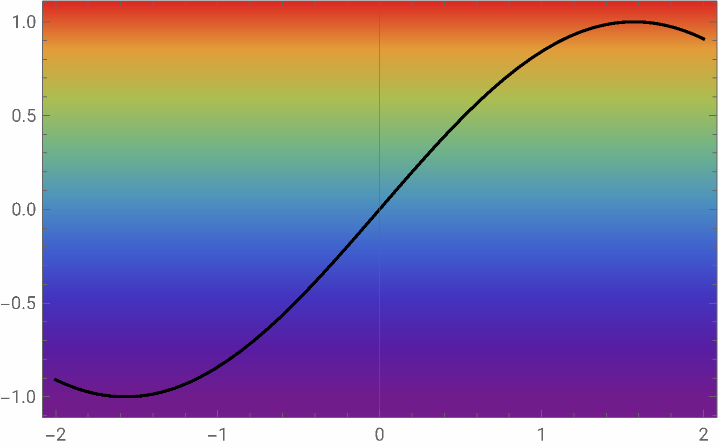
There are several things I don’t understand here, but maybe the following will give you a start.
This will form the background for various plots using different risk profiles.
Maybe you want to use Prolog. This allows you to insert graphics behind your plot. For example (obviously not tailored to your situation yet):
In[]:=
Plot[Sin[x],{x,-2,2},Prolog->{Pink,Disk[]}]
Out[]=
To get your rainbow color scheme, you can use LinearGradientFilling:
In[]:=
Plot[Sin[x],{x,-2,2},Prolog->{LinearGradientFilling["Rainbow"],Rectangle[]}]
Out[]=
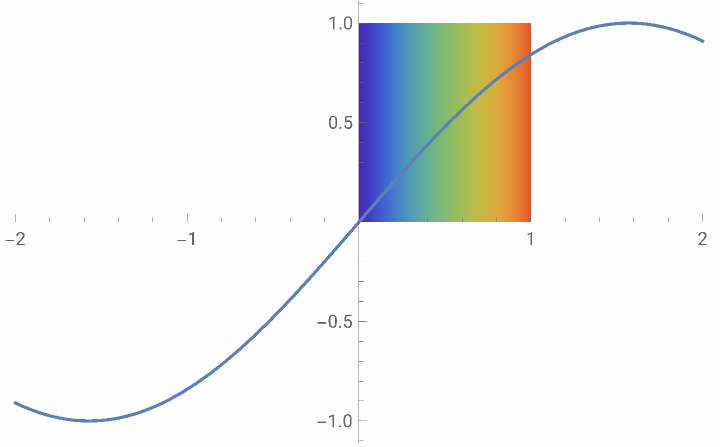
We need to scale this and orient it vertically.
In[]:=
Plot[Sin[x],{x,-2,2},Prolog->{LinearGradientFilling["Rainbow",Top],Rectangle[Scaled[{0,0}],Scaled[{1,1}]]}]
Out[]=
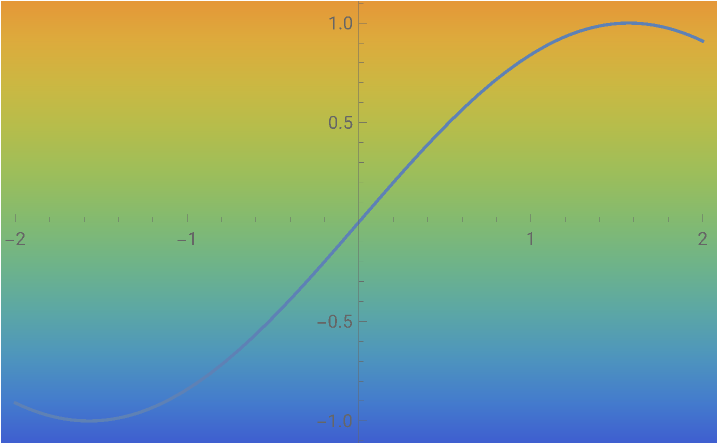
Okay, now things get a bit complicated. Since the image is wider than it is tall, we need to manually force it to scale the gradient. While we’re at it, let’s add a variable so we can re-use this easily.
In[]:=
MyRiskGradientBackground={LinearGradientFilling[Array[ImageScaled[#]->ColorData["Rainbow"][#]&,10,{0,1}],Top],Rectangle[Scaled[{0,0}],Scaled[{1,1}]]}
Out[]=
LinearGradientFilling,Rectangle[Scaled[{0,0}],Scaled[{1,1}]]



In[]:=
Plot[Sin[x],{x,-2,2},Prolog->MyRiskGradientBackground]
Out[]=
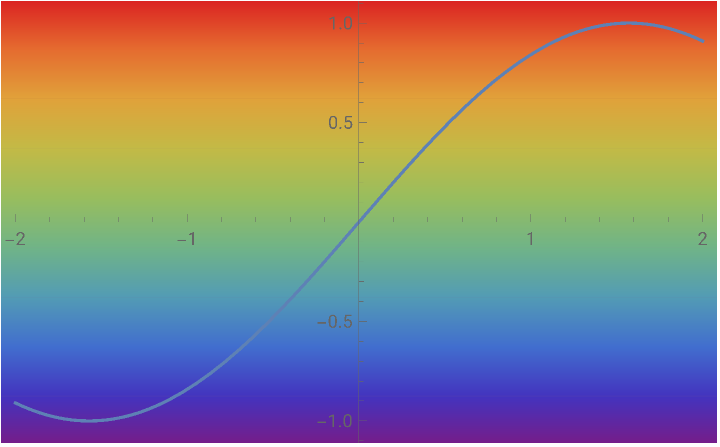
Then add a legend in the form of a colour bar and associated values.
The legend can be done with PlotLegends
In[]:=
BarLegend["Rainbow"]
Out[]=

But it looks to me like you want the gradient reversed, so we’ll need to make this a bit more complex. Again, I’ll save it in a variable for re-use.
In[]:=
MyRiskGradientLegend=BarLegend[{ColorData["Rainbow"][1-#]&,{0,1}}]
Out[]=

In[]:=
Plot[Sin[x],{x,-2,2},ColorFunction->(Black&),Frame->True,PlotLegends->MyRiskGradientLegend,PrologMyRiskGradientBackground]
Out[]=
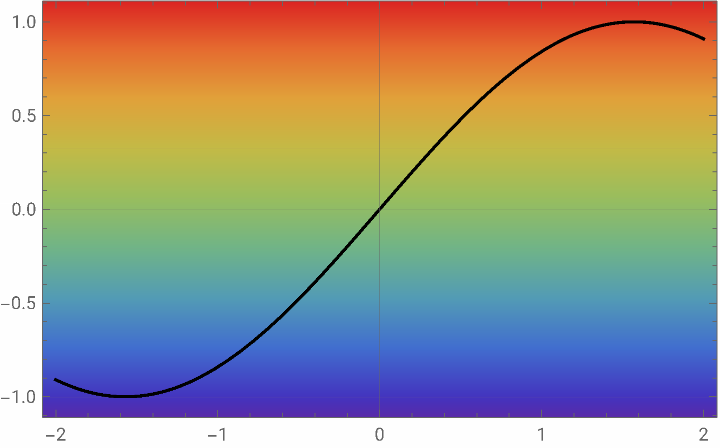
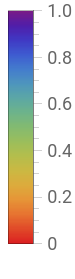
I made the plot itself black for clarity.
risk as a function of depth
I’m not sure I understand this, but it seems like you actually want something non-linear. This probably isn’t right, but it demonstrates a non-linear gradient. I’ll update the variable.
In[]:=
MyRiskGradientBackground={LinearGradientFilling[Array[ImageScaled[#]->ColorData["Rainbow"][#^2]&,10,{0,1}],Top],Rectangle[Scaled[{0,0}],Scaled[{1,1}]]}
Out[]=
LinearGradientFilling,Rectangle[Scaled[{0,0}],Scaled[{1,1}]]


In[]:=
Plot[Sin[x],{x,-2,2},ColorFunction->(Black&),Frame->True,PlotLegends->MyRiskGradientLegend,PrologMyRiskGradientBackground]
Out[]=