How do you calculate a bounding interval for a function domain?
How do you calculate a bounding interval for a function domain?
WernerGg, 18.-20..10.2023
I need a bounding interval for a function domain domF of a function f(x), i. e., any logical expression of inequalities, equalions, memberships and the like. An extremely simpel example that should lead to Interval[{0,90°}] is:
In[]:=
domF=(0<x<90°)
Out[]=
0<x<90°
The task should be accomplished by ImplicitRegion (domain region) and BoundingRegion (region interval). But this does not work, as you can see from:
In[]:=
Clear[x];Echo[domF=(0<x<90°),"domF: "];Echo[domR=ImplicitRegion[0<x<90°,{x}],"domR: "];Echo[intF=BoundingRegion[domR,"MinInterval"],"intF: "];
»
domF: 0<x<90°
»
domR: ImplicitRegion[0<x<90°,{x}]

»
intF: Interval[{0},{90°}]
BoundingRegion creates an interval with incorrect syntax.
Does anyone know what is wrong with my code? Or does anyone have a better idea how to get the interval?
Note that usually the function domain is much more complicated, for example:
Does anyone know what is wrong with my code? Or does anyone have a better idea how to get the interval?
Note that usually the function domain is much more complicated, for example:
In[]:=
domF=FunctionDomain[{1/2ArcSin[2Tan[x]],0<x<90°},x,Reals]
Out[]=
1
2
x
π
1
2
Another example
20.10.2023
In[]:=
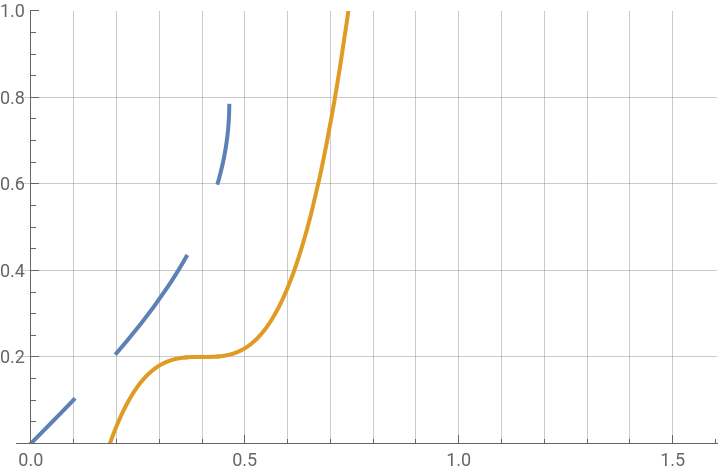
Clear[x,f1,f];c=2/10;f1[x_]:=20(x-4/10)^3;f[x_]:=Evaluate[1/2ArcSin[2Tan[Piecewise[{{1/2,Abs[f1[x]]<1/1000},{x,x<1/10},{x,x>2/10}},Undefined]]]];Plot[{f[x],f1[x]+c},{x,0,90°},PlotRange->{Automatic,{0,1}},GridLines->{Range[15]/10,Automatic},PlotLegends->"Expressions"]domF=FunctionDomain[{f[x],0<x<90°},x,Reals]
Out[]=


Out[]=
π+2x
2π

1
2
1
5
1
10