LHV of Producer Gas in Co-Gasification of Two Biomasses (Mathematica vs. Aspen-Plus)
Asma Hammami, Housam Binous, Hatem Dhaouadi and Ahmed Bellagi
LHV of Producer Gas in Co-Gasification of Two Biomasses (Mathematica vs. Aspen-Plus)
Asma Hammami, Housam Binous, Hatem Dhaouadi and Ahmed Bellagi
Asma Hammami, Housam Binous, Hatem Dhaouadi and Ahmed Bellagi
We consider olive pomace + grape pomace gasification (or biomass co-gasification) in the presence of oxygen only.
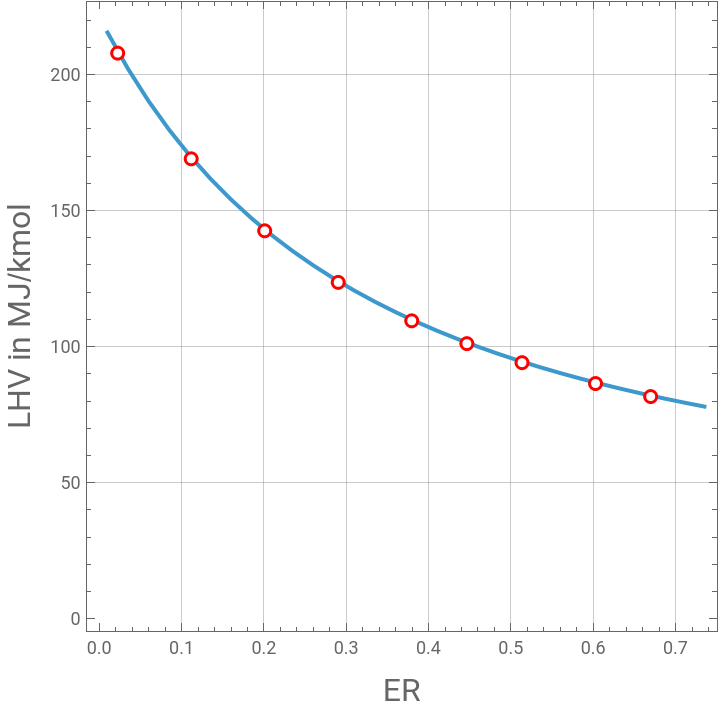
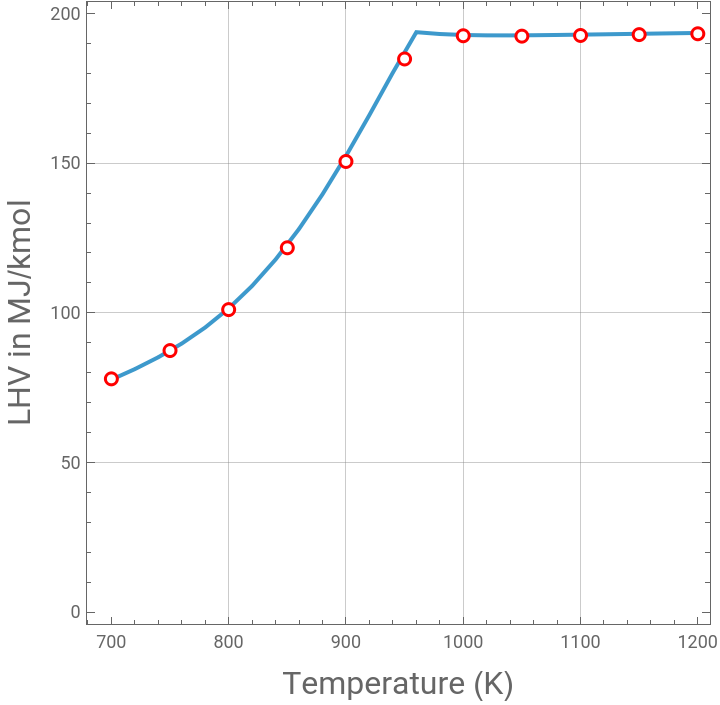
We investigate (1) the effect of temperature and (2) Equivalence Ratio (ER) on the Lower Heating Value (LHV) of the producer gas.
Based on proximate and ultimate analyses, given in Aspen-Plus, olive pomace is modeled as a pseudo-compound whose formula is while grape pomace is modeled as .
LHV calculated using Mathematica agree closely with their counterpart given by Aspen-Plus.
We investigate (1) the effect of temperature and (2) Equivalence Ratio (ER) on the Lower Heating Value (LHV) of the producer gas.
Based on proximate and ultimate analyses, given in Aspen-Plus, olive pomace is modeled as a pseudo-compound whose formula is
C
1
H
1.53015
O
0.501421
C
1
H
1.30934
O
0.438956
LHV calculated using Mathematica agree closely with their counterpart given by Aspen-Plus.
In[]:=
In[]:=
sol[{x_,ER_}]:=Quiet@FindMinimum[{Re[Gtot[x,P]],{n[7]<1/1000000,n[1]>0,n[2]>0,n[3]>0,n[4]>0,n[5]>0,n[6]>0,n[7]>0,n[8]>0,n[9]>0,n[10]>0},n[1]+n[5]+n[4]+n[10]1+1,4n[1]+2n[2]+2n[3]1.53015+1.30934,n[3]+n[4]+2n[5]+n[6]+2n[7]+2n[9]0.501421+0.438956+2ER2.2397,n[6]+n[7]+2n[8]0.0},Table[{n[j],0.07},{j,1,10}],MaxIterations10000,AccuracyGoal5];(*xistemperatureandERisequivalenceratio*)
Temperature effect on LHV for ER=0.446
In[]:=
P=1;
In[]:=
ER=1/2.2397(*equivalenceratio*)
Out[]=
0.446488
In[]:=
LHV=<|"H2"->242,"CO"->283.0,"CH4"->802.0|>;
In[]:=
tbl=Table[{T,y[2]*LHV["H2"]+y[4]*LHV["CO"]+y[1]*LHV["CH4"]/.sol[{T,ER}][[2]]},{T,700,1200,20}]
Out[]=
{{700,77.6723},{720,81.1962},{740,85.1608},{760,89.7363},{780,95.1087},{800,101.468},{820,108.992},{840,117.822},{860,128.034},{880,139.607},{900,152.391},{920,166.091},{940,180.267},{960,193.775},{980,193.162},{1000,192.839},{1020,192.713},{1040,192.703},{1060,192.757},{1080,192.846},{1100,192.951},{1120,193.064},{1140,193.18},{1160,193.295},{1180,193.408},{1200,193.518}}
In[]:=
p1=ListPlot[tbl,Frame->True,GridLines->Automatic,AspectRatio->1,Joined->True];
In[]:=
tbl2={{700,77.9444699},{750,87.3949567},{800,101.07839},{850,121.732832},{900,150.569325},{950,184.821545},{1000,192.577999},{1050,192.448577},{1100,192.672723},{1150,192.959634},{1200,193.241435}};
In[]:=
p2=ListPlot[tbl2,PlotMarkers->"OpenMarkers",PlotStyle->Red];(*Aspenresultsarerepresentedusingredopenmarkers*)
In[]:=
Show[p1,p2,FrameLabel->{Style["Temperature (K)",16],Style["LHV in MJ/kmol",16]}]
Out[]=
ER effect on LHV for T=800K
In[]:=
P=1;
In[]:=
ER=.(*equivalenceratio*)
In[]:=
LHV=<|"H2"->242,"CO"->283.0,"CH4"->802.0|>;
In[]:=
tbl=Table[{ER,y[2]*LHV["H2"]+y[4]*LHV["CO"]+y[1]*LHV["CH4"]/.sol[{800,ER}][[2]]},{ER,0.01,0.75,0.025}]
Out[]=
{{0.01,215.416},{0.035,202.01},{0.06,190.151},{0.085,179.6},{0.11,170.167},{0.135,161.692},{0.16,154.046},{0.185,147.12},{0.21,140.822},{0.235,135.077},{0.26,129.818},{0.285,124.99},{0.31,120.545},{0.335,116.442},{0.36,112.645},{0.385,109.124},{0.41,105.85},{0.435,102.8},{0.46,99.9538},{0.485,97.2919},{0.51,94.7982},{0.535,92.4582},{0.56,90.2587},{0.585,88.1883},{0.61,86.2364},{0.635,84.3937},{0.66,82.6517},{0.685,81.0029},{0.71,79.4403},{0.735,77.9575}}
In[]:=
p1=ListPlot[tbl,Frame->True,GridLines->Automatic,AspectRatio->1,Joined->True];
In[]:=
tbl2={{0.05,207.838366},{0.15,186.423541},{0.25,169.000076},{0.35,154.60348},{0.45,142.548195},{0.55,132.335232},{0.65,123.593859},{0.75,116.043619},{0.85,109.468944},{0.95,103.701766},{1,101.07839},{1.05,98.6093712},{1.15,94.0857436},{1.25,90.0453074},{1.35,86.4183224},{1.45,83.1474556},{1.5,81.6303924}};
In[]:=
tbl2=Table[{tbl2[[i]][[1]]/2.2397,tbl2[[i]][[2]]},{i,1,Length@tbl2,2}]
Out[]=
{{0.0223244,207.838},{0.111622,169.},{0.20092,142.548},{0.290217,123.594},{0.379515,109.469},{0.446488,101.078},{0.513462,94.0857},{0.602759,86.4183},{0.669733,81.6304}}
In[]:=
p2=ListPlot[tbl2,PlotMarkers->"OpenMarkers",PlotStyle->Red];(*Aspenresultsarerepresentedusingredopenmarkers*)
In[]:=
Show[p1,p2,FrameLabel->{Style["ER",16],Style["LHV in MJ/kmol",16]},PlotRange->All]
Out[]=