In[]:=
negateFirstRow[A_]:={-A[[1,All]]}~Join~A[[2;;,All]];sampleO[n_]:=RandomVariate@CircularRealMatrixDistribution@n;sampleSO[n_]:=With[{mat=sampleO@n},If[Det[mat]>0,mat,negateFirstRow@mat]];n=4;numSamples=20000;data=Flatten@Table[Eigenvalues@sampleSO@n,{numSamples}];ComplexListPlot[data,PlotStyle->{PointSize[Large],Opacity[.001]}]
Out[]=
In[]:=
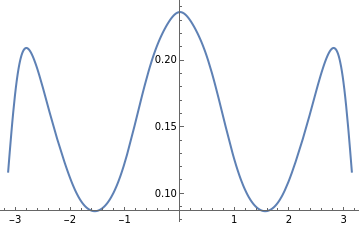
(*createsmoothkerneldistributionofArgs*)args=Arg@data;skd=SmoothKernelDistribution[args]Plot[PDF[skd,θ],{θ,-Pi,Pi}]
Out[]=
DataDistribution
Out[]=
(*create3dsectorchartbasedonPDFofthesmooothkerneldistribution*)dθ=Pi/50;createSector[θ_]:={dθ,1,PDF[skd,θ]}rangeArguments=Join[MinMax[args],{dθ}];thetaRange=Range@@rangeArguments;sectorList=createSector/@thetaRange;
In[]:=
SectorChart3D[sectorList]
Out[]=
