Take a surface mesh
Take a surface mesh
In[]:=
mr= ;
Extract its xyz point coordinates
Extract its xyz point coordinates
In[]:=
xyz=MeshCoordinates[mr];
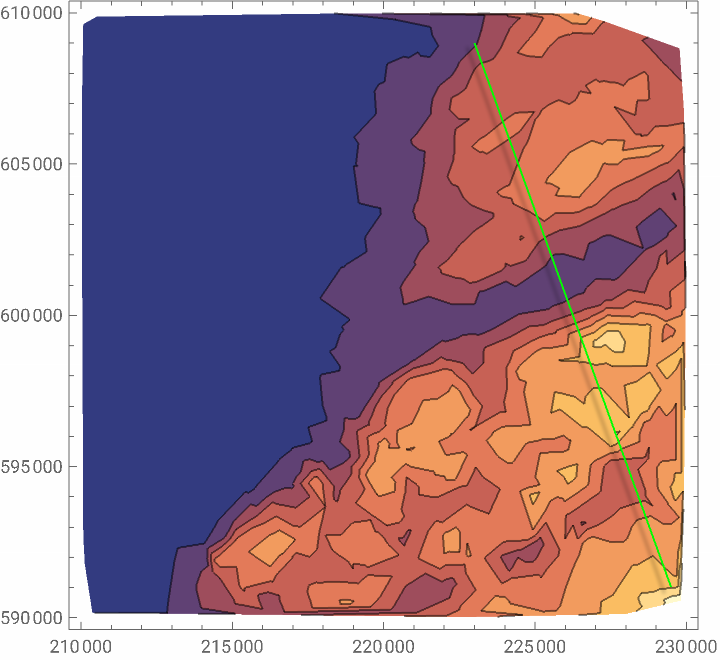
Contour the surface elevation data and define a section line
Contour the surface elevation data and define a section line
In[]:=
ListContourPlot[RandomSample[xyz,1000],Epilog->{Green,DropShadowing[],Line[sectionLine={{223000,609000},{229500,591000}}]}]
Out[]=

Get an interpolating function
Get an interpolating function
In[]:=
ifun=Interpolation[xyz/.{x_,y_,z_}->{{x,y},z},InterpolationOrder->1]
Out[]=
InterpolatingFunction


Define xy points along the section line
Define xy points along the section line
In[]:=
sectionLineLength=EuclideanDistance@@sectionLine;sectionLineUnitVector=Normalize[Subtract@@@Reverse/@Transpose[sectionLine]];nSectionPts=10000;segmentLength=sectionLineLength/(nSectionPts-1)//N;xySectionPts=Table[sectionLine[[1]]+i*segmentLength*sectionLineUnitVector,{i,0,nSectionPts}]
Out[]=
Interpolate elevation (z) values at all xy points along the section line
Interpolate elevation (z) values at all xy points along the section line
In[]:=
xyzSectionPts=xySectionPts/.{x_,y_}->{x,y,ifun[x,y]};
In[]:=
Show[mr,Graphics3D[{Red,Thickness[Large],Line[xyzSectionPts]}],Boxed->True,BoxRatios->{Automatic,Automatic,10000},ImageSize->Large,SphericalRegion->True]
Out[]=

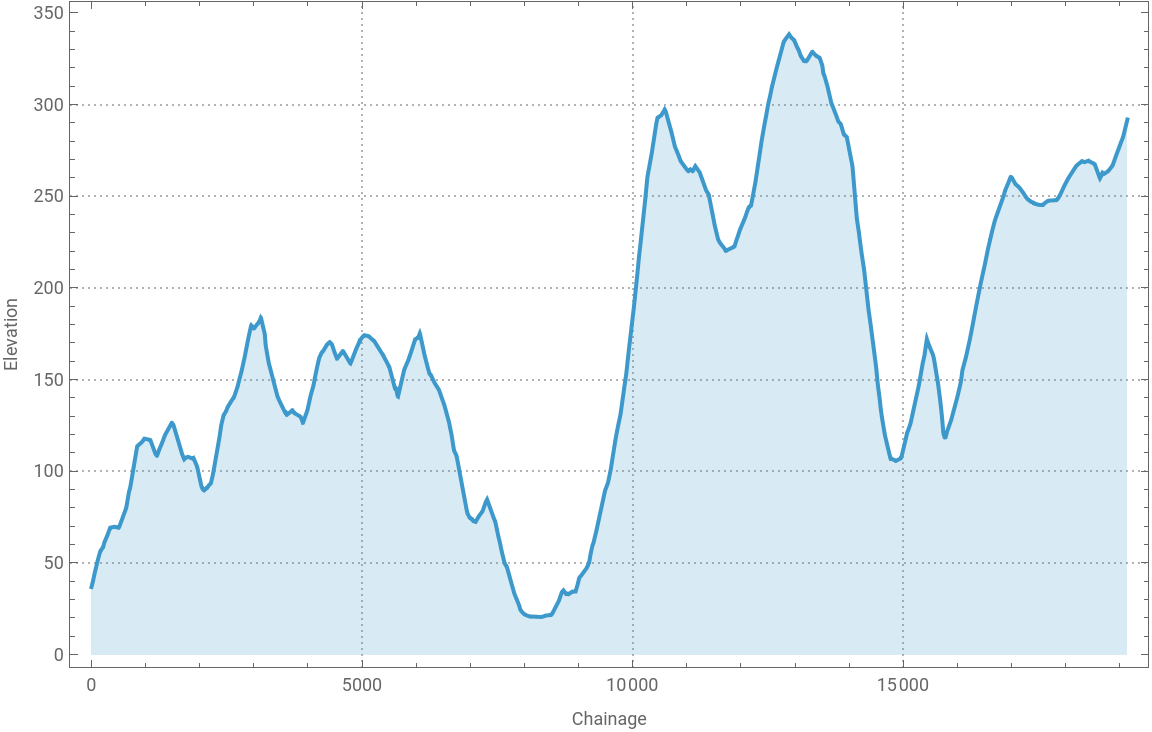
Plot the section in 2D
Plot the section in 2D
In[]:=
chzSectionPts=xyzSectionPts/.{x_,y_,z_}->{EuclideanDistance[{x,y},xySectionPts[[1,1;;2]]],z};ListLinePlot[chzSectionPts,Filling->Bottom,FrameLabel->{"Chainage","Elevation"}]
Out[]=
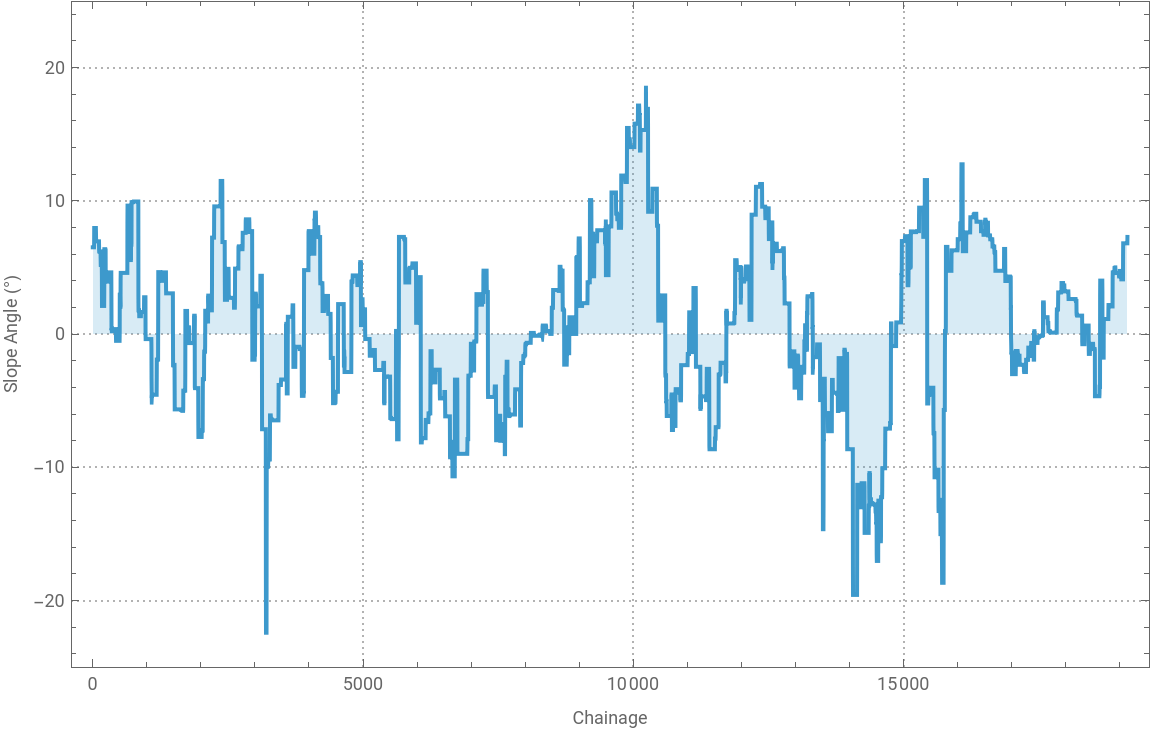
Calculate line segment slope angles relative to the horizontal
Calculate line segment slope angles relative to the horizontal
In[]:=
slopeAngles=Partition[chzSectionPts,2,1]/.{{x1_,y1_},{x2_,y2_}}->{0.5*(x1+x2),ArcTan[(y2-y1)/(x2-x1)]/Degree};
In[]:=
ListLinePlot[slopeAngles,Filling->Axis,FrameLabel->{"Chainage","Slope Angle (°)"},PlotRange->{Automatic,{-25,25}}]
Out[]=
Slope angles for the whole surface
Slope angles for the whole surface
Get normal vectors at mesh points. An alternative approach would be to use the normals at the centroid of each 2D mesh cell.
Calculate the slope angles (in angular degrees) relative to the horizontal. These slope angles are at the mesh nodes.
Build a list of {x-coordinate, y-coordinate, slope angle} values to be used in visualising the slope angles over the mesh domain.
Get the range of slope angles.
Contour the slope angles over the mesh domain.