@binocularity May 2023/June2023/September2023/February2026
In October 2024 NGESO changed to NESOso the links to data feeds were updated.
The fuel data used here has been cleaned and visualized and originally comes from NESO:
Updated Feb 2026
https://www.neso.energy/data-portal/historic-generation-mix
Find the cleaned data at the embedded URL links below to download your own copy.
In[]:=
(*Setupfoldersandintialisationcode*)folder=NotebookDirectory[];SetDirectory[folder];(*Pre-cleaneddata*)dayInYTD=CloudGet["https://www.wolframcloud.com/obj/binocularity/Published/dayInYTD"];dataD=CloudGet["https://www.wolframcloud.com/obj/binocularity/Published/dataD"];fuelColoursOrdered=CloudGet["https://www.wolframcloud.com/obj/binocularity/Published/fuelColoursOrdered"];datesLBlanks=CloudGet["https://www.wolframcloud.com/obj/binocularity/Published/datesLBlanks"];stringDate=CloudGet["https://www.wolframcloud.com/obj/binocularity/Published/stringDate"];fuelDSout=CloudGet["https://www.wolframcloud.com/obj/binocularity/Published/fuelDSout"];fuelPcDSout=CloudGet["https://www.wolframcloud.com/obj/binocularity/Published/fuelPcDSout"];weekTotalbyFuelGWh=CloudGet["https://www.wolframcloud.com/obj/binocularity/Published/weekTotalbyFuelGWh"];weekTotalbyFuelPcnt=CloudGet["https://www.wolframcloud.com/obj/binocularity/Published/weekTotalbyFuelPcnt"];histWeekTotalbyFuelGWh=CloudGet["https://www.wolframcloud.com/obj/binocularity/Published/histWeekTotalbyFuelGWh"];histWeekTotalbyFuelPcnt=CloudGet["https://www.wolframcloud.com/obj/binocularity/Published/histWeekTotalbyFuelPcnt"];(*FuelcolourschosentomatchNGESOpublications*)fuelColours=Association[{"GAS"RGBColor[Evaluate[{247,99,43}/255]],"COAL"RGBColor[Evaluate[{1,1,1}/255]],"NUCLEAR"RGBColor[Evaluate[{108,44,145}/255]],"WIND"RGBColor[Evaluate[{92,200,246}/255]],"HYDRO"RGBColor[Evaluate[{0,121,192}/255]],"IMPORTS"RGBColor[Evaluate[{194,0,119}/255]],"BIOMASS"RGBColor[Evaluate[{194,204,44}/255]],"OTHER"RGBColor[Evaluate[{255,205,243}/255]],"SOLAR"RGBColor[Evaluate[{253,231,1}/255]],"STORAGE"RGBColor[Evaluate[{255,255,255}/255]]}];styleColours=fuelColours[[#]]&/@Keys[fuelColoursOrdered];swatch=Reverse[fuelColoursOrdered];legend=SwatchLegend[Values[swatch],Keys[swatch]];dataReorder=dataD[All,Keys[fuelColoursOrdered]];Print[" Cleaned data dowloaded from the Cloud"]
Cleaned data dowloaded from the Cloud
In[]:=
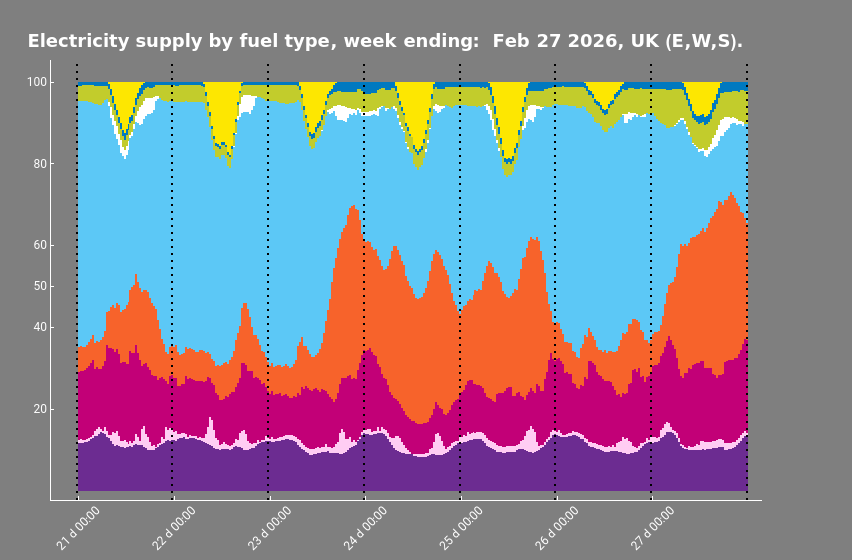
chartTitle=StringJoin[{"Electricity supply by fuel type, week ending: ",stringDate,", UK (E,W,S)."}];glBool=2;glOptions={None,{0,48,96,144,192,240,288,336}};id=glOptions[[2]]+1;id=id[[;;-2]];yTicks={20,40,50,60,80,100};newDates=datesLBlanks[[id]];newDates=Rotate[#,Pi/4]&/@newDates;xTicks=Partition[Riffle[id,newDates],2];interactive=Overlay[{Show[BarChart[dataReorder,BarSpacingAutomatic,ChartLayout"Stacked",ChartStyle{EdgeForm[],styleColours},AxesFalse,Method{"GridLinesInFront"True},GridLinesStyleDirective[Black,Medium,Thick,Dashing[Small]],GridLines{glOptions[[glBool]],None},ImageSize{Automatic,560},ImagePadding{{50,90},{60,60}},BackgroundRGBColor[{0.5,0.5,0.5}],Epilog{{},Text[Style[chartTitle,18,Bold,White],{155,110}]}],FrameStyleDirective[White,12],Frame{{True,None},{True,None}},FrameTicks{{yTicks,None},{xTicks,None}}],legend},Alignment{Right,Center}]
Out[]=
In[]:=
formattedDS=Dataset[fuelDSout,Background(If[#≤10,LightGreen,If[#≥(dayInYTD-10),LightRed,White]]&),AlignmentRight,HeaderStyle{"Bold","Code"},ItemStyle{"SubItem"}]
Out[]=
In[]:=
formattedPcDS=Dataset[fuelPcDSout,HeaderStyle->{"Bold","Code"},ItemStyle->{"SubItem"},Alignment->Right,ItemDisplayFunction->(NumberForm[#,{3,1}]&)]
Out[]=