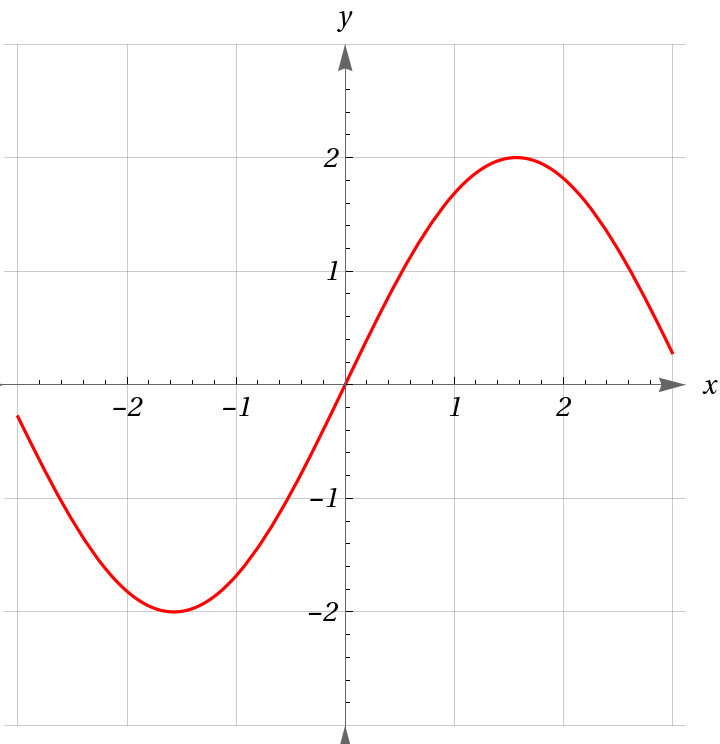
Version 1: Major and minor tickmarks appear
Version 1: Major and minor tickmarks appear
Plot[2Sin[x],{x,-3,3},PlotStyleRed,AxesLabel{x,y},PlotRange{-3,3},LabelStyleDirective[Black,14,Italic,FontFamily"Times New Roman"],GridLines{Range[-3,3,1],Range[-3,3,1]},Ticks{-2,-1,1,2},TicksStyleDirective[Black,Plain,12],AxesStyleArrowheads[{Automatic,Automatic}],AspectRatio1]
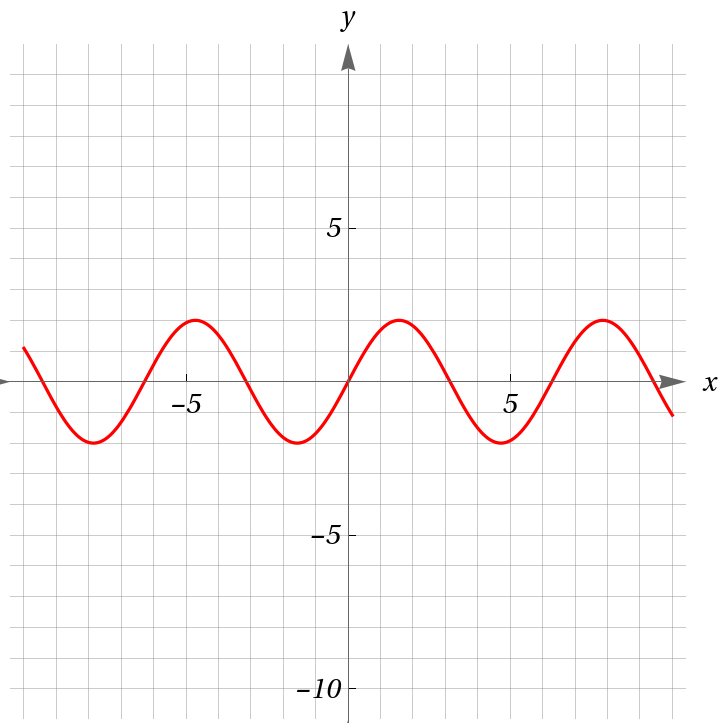
Version 2: Only major tickmarks appear
Version 2: Only major tickmarks appear
Plot[2Sin[x],{x,-10,10},PlotStyleRed,AxesLabel{x,y},PlotRange{-11,11},LabelStyleDirective[Black,14,Italic,FontFamily"Times New Roman"],GridLines{Range[-10,10,1],Range[-10,10,1]},Ticks{{-10,-5,5,10},{-10,-5,5,10}},TicksStyleDirective[Black,Plain,12],AxesStyleArrowheads[{Automatic,Automatic}],AspectRatio1]