The objective is to analyse efficacy of vaccination campaigns using covid vaccination data combined with cases/deaths data. In this study I compare deaths/cases between 2020 and 2021across all countries and try to find out if vaccinations had an significant impact.
Vaccination data could be downloaded from: https://github.com/owid/covid-19-data/tree/master/public/data/vaccinations .
Cases/Death data could be downloaded from: https://raw.githubusercontent.com/datasets/covid-19/main/data/countries-aggregated.csv
I’m using SQL Functions described and defined in previous post (https://community.wolfram.com/groups/-/m/t/2195893 )
In order to use Sql function I’ve created a Wolfram Package that can by found https://www.wolframcloud.com/env/damcalrom/Published/SQLOperators.wl
Prepare data for analysis
Prepare data for analysis
Get SQL package
CloudImport["https://www.wolframcloud.com/env/damcalrom/Published/SQLOperators.wl"];
Get vaccinate data
Source: https://raw.githubusercontent.com/owid/covid-19-data/master/public/data/vaccinations/vaccinations.csv
The structure of file is described at https://github.com/owid/covid-19-data/tree/master/public/data/vaccinations
Data transformation:
- Aggregate data by country and transform measures into time series.
- Exclude timeseries with less than 30 datapoints
filedata="https://raw.githubusercontent.com/owid/covid-19-data/master/public/data/vaccinations/vaccinations.csv";cols=Import[filedata,"Data"][[1,All]]//Map[StringReplace[#,"_"""]&,#]&;tbvacc=importSQL[filedata,",",cols]//groupBySQL[#,{location}]&//summarySQL[#,Association["tsvaccperc" (Transpose[{date,peoplevaccinatedperhundred}]//Cases[#,{t_,v_}/;NumberQ[v]]&//TimeSeries)]]&// (*filtersmalltimeseries*)whereSQL[#,Length[tsvaccperc["DatePath"]]>30]&;//AbsoluteTiming
Out[]=
{12.2539,Null}
Get covid cases and deaths data
Source: https://raw.githubusercontent.com/datasets/covid-19/main/data/countries-aggregated.csv
Data transformation:
- Aggregate data by country and transform measures into time series
- Exclude negative values and apply Differrences to have daily values instead of original cumulative values
- Exclude timeseries with less than 100 datapoints
- Correction of some country names.
- Apply a rolling 7 day average on measures.
filecases="https://raw.githubusercontent.com/datasets/covid-19/main/data/countries-aggregated.csv";tbcases=importSQL[filecases,",",{"date","country","confirmed","recovered","deaths"}]//rowMapSQL[#,{country},StringReplace[#,"US"->"United States"]&]&//groupBySQL[#,{country}]&//summarySQL[#,Association["tscases"(TimeSeries[confirmed,{date}]//Differences//Normal//Cases[#,{t_,v_}/;v>0]&//TimeSeries),"tsdeaths"(TimeSeries[deaths,{date}]//Differences//Normal//Cases[#,{t_,v_}/;v>0]&//TimeSeries)]]&//whereSQL[#,Length[tscases["DatePath"]]>100&&Length[tsdeaths["DatePath"]]>100]&//rowMapSQL[#,{tscases,tsdeaths},MovingMap[Mean,#,Quantity[7,"Events"],Automatic]&]&;//AbsoluteTiming
Out[]=
{108.747,Null}
Join the 2 datasets
tbjoin=tbcases//joinSQL[#,tbvacc,{country},{location}]&//rowMapSQL[#,{country,location},StringReplace[#,{"Czechia"->"CzechRepublic","Cote d'Ivoire"->"IvoryCoast"}]&]&//addColumnsSQL[#,Association["population"(CountryData[location,"Population"]//QuantityMagnitude)]]&;//AbsoluteTimingtbjoin//whereSQL[#,country"France"]&//tableSQLAsDataset
Out[]=
{0.0632108,Null}
Out[]=
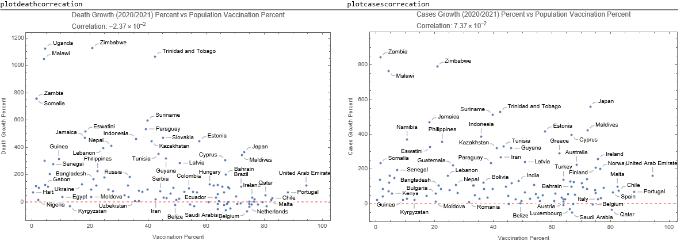
Calculate additional variables used is analysis deathrate2020 = Total Covid 2020 deaths / Population * 100 000 deathrate2021 = Total Covid 2021 deaths /Population * 100 000 cases2020 = Total Covid 2020 cases / Population * 100 000 cases2021 = Total Covid 2021 cases /Population * 100 000 deathgrowth = (deathrate2021- deathrate2020 ) /deathrate2020 *100 casesgrowth = (cases2021- cases2020 ) /cases2020 *100 vaccination percent = percentage of peoples that got at least one dose of covid vaccine vaccinationsegment = segmentation of vaccination percent used to group based on vaccination percent ( eg 20 % vaccination belongs to “20 -60” segment )
(*functiontocalculatevaluesegmentbasedoncustomsegmentation*)segmentValue[x_,range_List]:=range//Partition[#,UpTo[2],1]&//Cases[#,{min_,max_}/;x>min&&x≤maxStringRiffle[{min,max},"-"]]&//Check[#//First,"UNKNOWN"]&//Quiet;segmentValue[70,{0,20,60,100}];window2020=DateObject[{2020},"Year"];window2021=DateObject[{2021},"Year"];tb2020vs2021=tbjoin//addColumnsSQL[#,Association["deathrate2020"(((tsdeaths//TimeSeriesWindow[#,window2020]&//Total//N)*100000/population)//If[NumberQ[#],#,0]&//Quiet),"deathrate2021"(((tsdeaths//TimeSeriesWindow[#,window2021]&//Total//N)*100000/population)//If[NumberQ[#],#,0]&),"casesrate2020"(((tscases//TimeSeriesWindow[#,window2020]&//Total//N)*100000/population)//If[NumberQ[#],#,0]&//Quiet),"casesrate2021"(((tscases//TimeSeriesWindow[#,window2021]&//Total//N)*100000/population)//If[NumberQ[#],#,0]&//Quiet),"vaccinationpercent"tsvaccperc["LastValue"]]]&//addColumnsSQL[#,Association["vaccinationsegment"segmentValue[vaccinationpercent,{0,20,65,100}],"deathgrowth"(Check[(deathrate2021/deathrate2020-1)*100,0]//Quiet),"casesgrowth"(Check[(casesrate2021/casesrate2020-1)*100,0]//Quiet)]]&//(*whereSQL[#,deathgrowth<1000]&//*)selectSQL[#,{country,deathrate2020,deathrate2021,deathgrowth,casesrate2020,casesrate2021,casesgrowth,vaccinationpercent,vaccinationsegment}]&//orderBySQL[#,{-vaccinationpercent}]&;//AbsoluteTiming
Out[]=
{0.504609,Null}
{0.3139882`,Null}
Out[]=
{0.313988,Null}
Explore final dataset
tb2020vs2021//whereSQL[#,country"France"]&//tableSQLAsDataset
Out[]=
Plot death Growth/Cases Growth vs Vaccination percent and get the correlation factor
Plot death Growth/Cases Growth vs Vaccination percent and get the correlation factor
customCorrPlot[x_,y_,callouts_,plotlabel_,xlabel_,ylabel_]:=With[{dataplot=MapThread[Callout,{Transpose[{x,y}],callouts}],corr=Correlation[x,y]},dataplot//ListPlot[#,PlotLabelColumn[{plotlabel,Row[{"Correlation: ",ScientificForm[corr,3]}]}],FrameLabel{xlabel,ylabel},FrameTrue,GridLines{None,{{0,Directive[Red,Dashed,Thick]}}},ImageSizeLarge]&];tb2020vs2021//summarySQL[#,Association["plotdeathcorrecation"customCorrPlot[vaccinationpercent,deathgrowth,country,"Death Growth (2020/2021) Percent vs Population Vaccination Percent","Vaccination Percent","Death Growth Percent"],"plotcasescorrecation"customCorrPlot[vaccinationpercent,casesgrowth,country,"Cases Growth (2020/2021) Percent vs Population Vaccination Percent","Vaccination Percent","Cases Growth Percent"]]]&//showTableSQL
Total Rows:1 Elapsed:1.09152
Out[]//TableForm=
Cross correlation and independence tests between variables
Cross correlation and independence tests between variables
I’ll perform a cross correlation between variables of dataset (for those familiar with R similar to corplot ).
https://cran.r-project.org/web/packages/corrplot/vignettes/corrplot-intro.html
Define custom func to draw correlation , independent tests and scatterplot between 2 variables
https://cran.r-project.org/web/packages/corrplot/vignettes/corrplot-intro.html
Define custom func to draw correlation , independent tests and scatterplot between 2 variables
Correlation color codes from strong to week correlation
Generate a cross tabulation between table columns using unpivotSQL and crossJoinSQL .
Apply custom correlation function to each combination of variables excluding same variable
First we check death rate related variables.
Apply custom correlation function to each combination of variables excluding same variable
First we check death rate related variables.
I’ll do the same exercise for cases rates variables