Nations rise and fall, their power and reach fluctuating over time. There are many theories about the patterns that nations follow during their lifespan. In this project, I created tools that allowed me to visualize how borders and patterns of conquest changed over time. These tools can be used to take a closer look at highly contested regions, patterns of conquest, and the mutating shapes of nations. These visualizations reveal small and large scale patterns in which regions are most desired throughout history. The first type of visualization is a map which shows where historical countries overlapped. Through these maps, one can determine which regions were highly contested and make inferences about nations’ motivations for taking control of various regions. The second type of visualization is a 3D stacked timeline of one country. This visualization can provide insight into the fluctuations in the shape and size of countries over time.
Introduction
Introduction
Throughout history, the borders of the world have shifted with the rise and fall of nations. There are many factors that can influence how nations interact with each other. Nations go to war and claim new territory for money, power, resources, and glory. But with the ever changing world, have the reasons conquest war changed over time? Have the highly contested areas shifted? How consistent are borders between regions as countries change?
The needs of nations have greatly changed. While nations used to primarily need access to ports and natural resources, that is not necessarily the case anymore. The world has changed significantly with every new technological and ideological development. The ease with which goods and messages can be sent around the world makes proximity to ports and access to a variety of resources far less relevant than in the past. Now, many nations specialize in a few goods or resources to export. While some of these resources have stayed consistent, such as food and spices, others are newer to modern times, such as oil.
Additionally, the ideologies of nations can affect how they expand and conquer territory. One consistency is the influence of religion on how contested a region is. For example, the region surrounding Israel, the Levant, has been fought over many times throughout history, from the Crusades to the modern struggle between Israel and Palestine, with nations citing religious motivations. Other ideologies fade in an out of influence, like mercantilism. After mercantilism was popularized, many European nations sought to expand into far off colonies in order to capitalize off of the natural resources in those regions by maximizing their exports and minimizing their imports.
Similarly, specific events can greatly impact how nations act in the future. One example of this is the Cold War, with the standoff between the United States and Russia influencing both nations to intervene in the regions neighboring their opponent, as well as regions with opposing political ideologies. This intervention created more turmoil within these regions.
This project examines historical countries and highly contested regions and how they changed over time. Through visualizations capable of looking at select time periods, this project attempts to gain insight into the patterns that historical countries follow in their quest to expand.
Defining Data
Defining Data
In order to build a usable dataset, I first gathered the list of historical countries from the Wolfram dataset. Then, because I was working with maps, I filtered the country list to only include entities that have a defined polygon that could be placed on a map. Then I filtered the country list again to only include countries with start dates and end dates. I also needed to account for current countries not having an end date. I put all of my data lists into Wolfram cloud to conserve space.
Original code which creates a list of historical countries
histCountriesCloud=EntityList["HistoricalCountry"]
Original code which filters out all countries that do not have a shape to be put on a map
filteredHistCountriesCloud=Select[histCountriesCloud,EntityValue[#,EntityProperty["HistoricalCountry","HasPolygon"]]&];
Original code which filters out all countries that do not have a start date
filteredHistCountriesCloud2=Select[filteredHistCountriesCloud,!MissingQ[EntityValue[#,EntityProperty["HistoricalCountry","StartDate"]]]&];
Original code which filters out all countries that do not have an end date, accounting for countries whose end date is present and therefore have a set end date of Missing[NotApplicable]
filteredHistCountriesCloud3=Select[filteredHistCountriesCloud2,!MissingQ[EntityValue[#,EntityProperty["HistoricalCountry","EndDate"]]||EntityValue[#,EntityProperty["HistoricalCountry","EndDate"]]==Missing["NotApplicable"]]&];
Retrieves list of historical countries from cloud
In[]:=
histCountries=CloudGet[CloudObject[
https://www.wolframcloud.com/obj/14e5c715-7788-4585-af86-d3fa958e798d
]]Retrieves first filtered list of historical countries from cloud
In[]:=
filteredHistCountries=CloudGet[CloudObject[
https://www.wolframcloud.com/obj/b9255ceb-8226-40f9-b5f6-7e33fdd500ed
]]Retrieves second filtered list of historical countries from cloud
In[]:=
filteredHistCountries2=CloudGet[CloudObject[
https://www.wolframcloud.com/obj/a12c2ec9-bee5-4c70-bbce-f23594c7b492
]]Retrieves third filtered list of historical countries from cloud
In[]:=
filteredHistCountries3=CloudGet[CloudObject[
https://www.wolframcloud.com/obj/320b9165-8f4f-467f-8485-2e45d366aecb
]]Examining Historical Country Overlap
Examining Historical Country Overlap
World Map
World Map
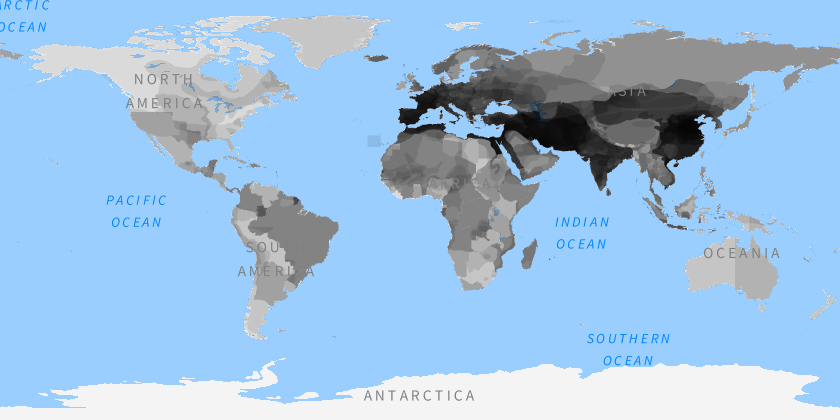
First, I wanted to be able to visualize all country overlap throughout time which can show which regions changed hands more frequently than others. The darker regions show areas which belonged to many nations while the lighter regions show areas which belonged to very few. This map clearly shows how many more nations engaged in conquest in Europe and Asia than North America, South America, and Africa, which is to be expected. It also shows how the northernmost and southernmost regions of the world were far less contested. Additionally, the map shows a clear region which was most contested, being the areas of Europe and Asia that are along the same latitudes, creating a darker band across those continents.
Creates world map overlaid with every historical country at low opacity
GeoGraphics[{GeoStyling[Opacity[0.1]],Black,Table[filteredHistCountries[[i]]["Polygon"],{i,Length[filteredHistCountries]}]},GeoBackground->"VectorMinimal"]
Out[]=
Closer Examination
Closer Examination
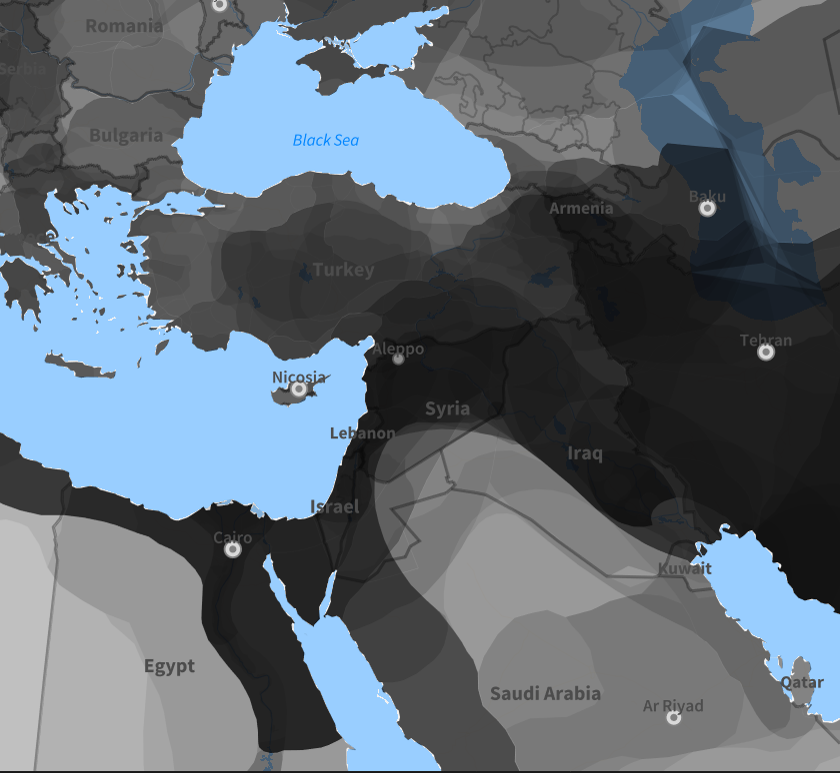
Next, I wanted to be able to focus on one area in order to get a closer look at specific regions. This function allows the user to select a specific country to center on and the size of the area they want to look at. By taking a closer look at these regions, the map shows more regional patterns of conquest and gives insight into how nations took used those regions. For example, the map centered around Syria shows a darker region of frequently claimed territory connecting the Mediterranean sea, the Red Sea, and the Persian Gulf. This could demonstrate how nations wanted to connect many ports on different bodies of water to optimize trade with several regions.
Creates function for a map to edit focus area, focus range, and opacity of the map
In[]:=
closeCountry[country_,area_,opacity_:0.125]:=GeoGraphics[{GeoStyling[Opacity[opacity]],Black,Table[filteredHistCountries[[i]]["Polygon"],{i,Length[filteredHistCountries]}]},GeoBackground->"VectorMinimal",GeoRange->Quantity[area,"Kilometers"],GeoCenter->Entity["Country",StringDelete[country," "]]]
Map example of Syria
closeCountry["Syria",1300,0.075]
Out[]=
Selecting Time Periods
Selecting Time Periods
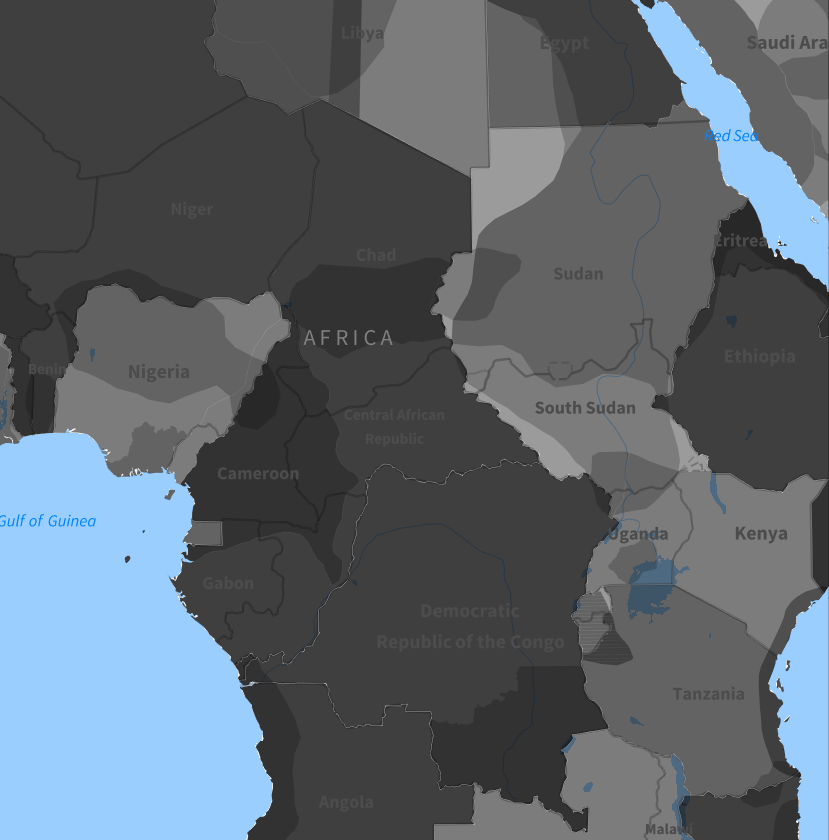
One of the major questions of this project is how trends in contested areas changed over time. In order to examine this, I altered the previous zoomed in country function to allow the user to select a specific date range to look at. These narrower views reveal some similarities in that there is frequently a higher concentration of countries having controlled regions near water, especially around the Mediterranean. Additionally, these maps can reinforce what is already known about history. For example, by examining various time periods of Africa, one can see how there was minimal activity in Africa from 1700-1800. Then more activity from 1800-1900, with Europe’s partition of Africa occurred in the late 1800s. In the period 1900-2000, Africa saw significantly more ownership and border change, helping to show how Europe’s intervention and colonization of Africa led to future turmoil across the continent.
Creates function for closely examining a country that better works with the following date specific function
In[]:=
closeCountryFunc[countryList_,country_,area_,opacity_:0.125]:=GeoGraphics[{GeoStyling[Opacity[opacity]],Black,Table[countryList[[i]]["Polygon"],{i,Length[countryList]}]},GeoBackground->"VectorMinimal",GeoRange->Quantity[area,"Kilometers"],GeoCenter->Entity["Country",StringDelete[country," "]]]
Creates function for a map to edit date range, focus area, focus range, and opacity of countries displayed on the map by filtering through the historical countries list for specific start and end dates
In[]:=
datedMap[startDate_,endDate_,country_,area_,opacity_:0.125]:=Module[{countriesList1,countriesList2},countriesList1=Select[filteredHistCountries3,endDate>=DateValue[EntityValue[#,EntityProperty["HistoricalCountry","StartDate"]],"Year",Integer]&];countriesList2=Select[countriesList1,Which[MissingQ[EntityValue[#,EntityProperty["HistoricalCountry","EndDate"]]],startDate<=DateValue[Today,"Year",Integer],True,startDate<=DateValue[EntityValue[#,EntityProperty["HistoricalCountry","EndDate"]],"Year",Integer]]&];closeCountryFunc[countriesList2,country,area,opacity]]
Map example centered on the Central African Republic from 1900-2000
datedMap[1900,2000,"Central African Republic",2300,0.2]
Out[]=
Visualizing Changing Trends Over Time
Visualizing Changing Trends Over Time
Partial Map Animated Visualization
Partial Map Animated Visualization
In order to properly visualize how the highly contested regions changed over time, I created an animation to run through set periods of time and show the shifts. This animation shows how nations began claiming territory North of the Mediterranean fairly early on, while they waited much longer to appear to the South in Africa. This could be due to the fact that Northern Europe was easier to trade with and easier to extract resources from than Northern Africa, showing how nations prioritized resources and trade in their expansion.
Creates function altered from previous date range map function that better works with below function by allowing specification for start date and time period to look at rather than date range
In[]:=
animDate[startDate_,period_,country_,area_,opacity_:0.125]:=Module[{countriesList1,countriesList2},countriesList1=Select[filteredHistCountries3,(startDate+period)>=DateValue[EntityValue[#,EntityProperty["HistoricalCountry","StartDate"]],"Year",Integer]&];countriesList2=Select[countriesList1,Which[MissingQ[EntityValue[#,EntityProperty["HistoricalCountry","EndDate"]]],startDate<=DateValue[Today,"Year",Integer],True,startDate<=DateValue[EntityValue[#,EntityProperty["HistoricalCountry","EndDate"]],"Year",Integer]]&];closeCountryFunc[countriesList2,country,area,opacity]]
Creates a table of maps for the example of Italy from 0-2026 with a year step size of 50 years, with each image looking at a time period of 200 years
In[]:=
mapList=Table[animDate[t,200,"Italy",2000,0.175],{t,0,2026,50}];
Animation of time periods map of Italy example
In[]:=
timePeriodAnim=Manipulate[mapList[[t]],{{t,1,"Year"},Range[Length[mapList]],ControlType->Animator,AnimationRunning->False},SaveDefinitions->True]
In[]:=
Video[CloudObject["https://www.wolframcloud.com/obj/b728919c-4fec-47be-a68d-e0c677445094"]]
Full Map Animated Visualization
Full Map Animated Visualization
I also wanted to be able to visualize how global trends in contested regions changed. In doing this, one might be able to examine the effects of mercantilism, colonization, Manifest Destiny, and other economic, social, and political theories as they were introduced. This visualization clearly shows how nations expanded from one central area in Europe and Asia to all around the world. The Mediterranean was consistently one of the most highly contested regions. This could be due to its resources or its position in the center of trade. Alternatively, the trend could continue throughout history because so many nations were already present in the region, thus creating a greater likelihood of conflict and border fluctuation in the future.
Creates function for a map to edit list of countries used, and opacity of the world map
Creates altered function for a map to edit the start date, time period of dates, and opacity of countries displayed on the world map
Creates a table of maps for the example of the world from 0-2026 with a year step size of 50 years, with each image looking at a time period of 200 years
Animation of time periods map of the world example
Interactive Map Showing Overlap
Interactive Map Showing Overlap
Unfortunately, due to the nature of the historical countries dataset, not all nation changes were caused due to conquest and war. Some nations, such as China, may appear darker simply because of political revolutions, name changes, or dynasty changes. In order to account for this, I created an interactive, clickable map to be able to view what historical countries each region was a part of in order to properly determine how they changed hands. This makes it easier to determine whether a darkened region is significant in that it was highly contested or if it simply experienced a lot of internal turmoil and political turnover.
Creates function for getting historical countries at whichever point was clicked on using GeoIdentify and grabbing the geographic coordinates, then filtering for the correct date range
Create a function that combines creating the map and making it a clickable object
Clickable time period map example centered on China
Examining Shifting Country Shapes
Examining Shifting Country Shapes
While the majority of this project deals with the overlap of many countries, I wanted to be able to focus on how one country changed over time as well. I created a 3D graphic that allows the user to visualize the progression a country’s shape. This graphic shows how empires fluctuate, expanding and contracting until they fall.
Creates list of a country’s polygon shapes properly formatted for the 3D graphic throughout the selected years
Creates a list of random colors with the same length as the inputted list
Creates a stacked 3D graphic from the list of country polygons
Creates a list of stacked 3D graphics including a decreasing amount of layers
Creates a list of polygons of the Roman Empire from 110-120AD
Creates a list of random colors with the same length as listOfCountries
Creates a list of 3D country stacks using the list of Roman Empire polygons and the list of random colors
Creates an interactive stack of the Roman Empire at different years
Conclusion
Conclusion
Through this project, I successfully created several visualizations to aid in the analysis of changing borders and highly contested geographical regions.
The first type of visualization provides insight into the overlap of historical countries, showing frequently conquered areas and highly contested regions. These visualizations show how nations changed more frequently as time went on and reveal that areas such as the Mediterranean were highly desired compared to regions like Northern Canada. One of the maps in this type of visualization allow the user to click and determine what nations a region has been a part of, helping with determining the reasons that a region changed hands. However, this method of visualization does not differentiate between changes in territory ownership and changes in nation name. Additionally, this method makes it difficult to determine the reasons for conquest.
The second type of visualization focuses more narrowly on one country. Using this visualization, users can examine a 3D timeline to look at how the shape of one nation changes over time. However, this method of visualization is limited because users can only view one country at a time and making stacks of many years can be computationally intensive.
Some of my observations from these visualizations were as I expected, following what is known about history, such as the example of Europe’s influence in Africa. However, some observations were surprising. The example of the region around Syria, with the frequent connection of the Mediterranean Sea, the Red Sea, and the Persian Gulf, was unexpected and I was able to hypothesize about the reasons for this. While not every observation directly connected to something I knew about history, they were logical and I was able to reason why they may have occurred.
Future Directions
Future Directions
While this project created useful visualizations for examining the overlap of historical countries, there are many ways that it could be improved to allow more precise analysis.
First, the historical countries dataset includes every name change of countries regardless of if the country changed. This makes region like China appear to be highly contested even though many of the overlaid countries represent dynasty changes. To make these visualizations more useful to examining the reasons for border changes and conquest, one should create a method to separate name changes from conquering.
Additionally, the 3D timeline could be improved. One way of doing this is by altering the visualization to be able to view whole continents. Another way of doing this is by making the stack of countries visible to be analyzed from the side.
Acknowledgements
Acknowledgements
Thank you to my mentor, Dan McDonald, who helped me figure out methods for reaching my desired results. I would also like to thank Anne Shuai, Divya Thota, Amrita Kumar, William Choi-Kim, Kaavya Majumder, Aanya Gupta, and all of the other TAs who helped me figure out technical issues with my code. Also, thank you to Bret Champion for help using GeoGraphics in ClickPane. Finally, I want to thank the directors Rory Foulger, Eryn Gillam, and Megan Davis for all of their help brainstorming and troubleshooting.
Additional thanks to Stephen Wolfram for suggesting this project.
Additional thanks to Stephen Wolfram for suggesting this project.
CITE THIS NOTEBOOK
CITE THIS NOTEBOOK
Examining historical country overlap and contested regions
by Suzette Head
Wolfram Community, STAFF PICKS, July 9, 2026
https://community.wolfram.com/groups/-/m/t/3754029
by Suzette Head
Wolfram Community, STAFF PICKS, July 9, 2026
https://community.wolfram.com/groups/-/m/t/3754029