Gas Constant expressed in kcal/kmol*K and Pressure expressed in mmHg
In[]:=
R=1.987;P=760;
Activity coefficients using NRTL model
Component 1 = 1-Butanol
Component 2 = Water
Component 1 = 1-Butanol
Component 2 = Water
In[]:=
Gam[i_]:=Exp(t[j,i]G[j,i]x[j])(G[l,i]x[l])+(G[l,j]x[l])t[i,j]-(t[r,j]G[r,j]x[r])(G[l,j]x[l])/.x[1]x1/.x[2]1-x1
2
∑
j=1
2
∑
l=1
2
∑
j=1
G[i,j]x[j]
2
∑
l=1
2
∑
r=1
2
∑
l=1
In[]:=
Gamp[i_]:=Exp(t[j,i]G[j,i]x[j])(G[l,i]x[l])+(G[l,j]x[l])t[i,j]-(t[r,j]G[r,j]x[r])(G[l,j]x[l])/.x[1]xp1/.x[2]1-xp1
2
∑
j=1
2
∑
l=1
2
∑
j=1
G[i,j]x[j]
2
∑
l=1
2
∑
r=1
2
∑
l=1
In[]:=
G[i_,j_]:=Exp[-a[i,j]t[i,j]]
In[]:=
t[i_,j_]:=g[i,j]/(R(T+273.15))
Binary interaction parameters and non-randomness factors are taken from Aspen-HYSYS
g[1,1]=0;g[2,2]=0;g[2,1]=2794.6660;g[1,2]=570.13620;a[1,1]=0;a[2,2]=0;a[1,2]=0.47;a[2,1]=0.47;
Vapor Pressure Using Antoine Equation
In[]:=
A1=7.36366;B1=1305.198;C1=173.427;
In[]:=
A2=8.07131;B2=1730.630;C2=233.426;
In[]:=
PS1=10^(A1-B1/(C1+T));PS2=10^(A2-B2/(C2+T));
Normal boiling temperatures
In[]:=
FindRoot[PS1P,{T,100,120}]
Out[]=
{T117.727}
In[]:=
FindRoot[PS2P,{T,100,120}]
Out[]=
{T99.9968}
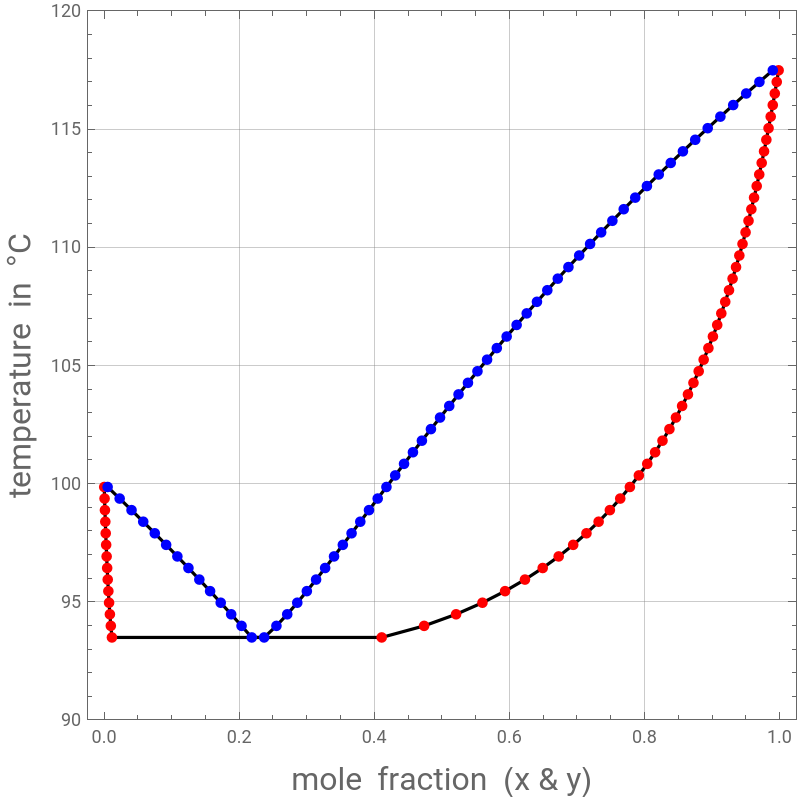
Heterogeneous Azeotrope (overall liquid composition 22.6 mole % and b.p. 93.24 °C)
In[]:=
FindRoot[{y1Gam[1]x1PS1/P,Gam[1]x1PS1/PGamp[1]xp1PS1/P,Gamp[1]xp1PS1+Gamp[2](1-xp1)PS2P,Gam[1]x1PS1+Gam[2](1-x1)PS2P},{x1,0.005,0.01},{xp1,0.35,0.4},{y1,0.2,0.25},{T,90,95}]
Out[]=
{x10.0124991,xp10.366001,y10.226053,T93.2468}
Computing VLE data
In[]:=
i=0;
In[]:=
While[i<101,{T=Evaluate[93.2468+i(117.727-93.2468)/100],Temp[i]=T,x1[i]=FindRoot[{Gam[1]x1PS1+Gam[2](1-x1)PS2P},{x1,0.3,0.95}][[1,2]],xp1[i]=FindRoot[{Gam[1]x1PS1+Gam[2](1-x1)PS2P},{x1,0.005,0.01}][[1,2]],y1[i]=Gam[1]x1PS1/P/.x1x1[i],yp1[i]=Gam[1]x1PS1/P/.x1xp1[i],i++}]
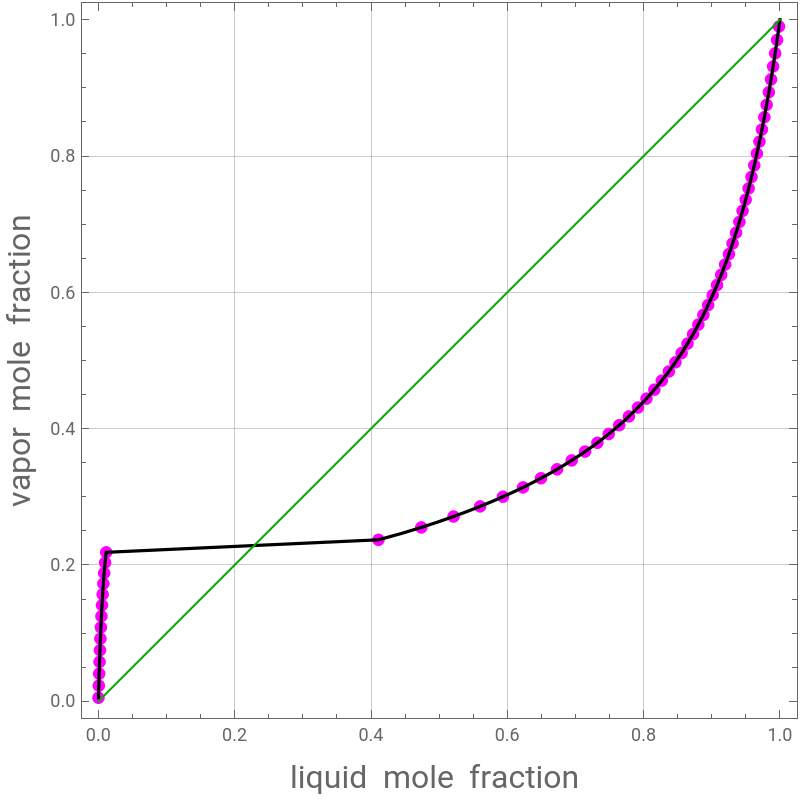
T-xy and xy plots for the 1-Butanol - water system
In[]:=
tb1=Table[{x1[i],Temp[i]},{i,1,100,2}];
In[]:=
tb2=Table[{xp1[i],Temp[i]},{i,1,27,2}];
In[]:=
tb3=Table[{y1[i],Temp[i]},{i,1,100,2}];
In[]:=
tb4=Table[{yp1[i],Temp[i]},{i,1,27,2}];
In[]:=
tbf1=Sort[Join[tb1,tb2]];
In[]:=
tbf2=Sort[Join[tb3,tb4]];
In[]:=
plt1=ListPlot[tbf1,PlotStyle{RGBColor[1,0,0],PointSize[0.015]},PlotRange{{-0.2,1.2},{90,120}}];
In[]:=
plt2=ListPlot[tbf2,PlotStyle{RGBColor[0,0,1],PointSize[0.015]},PlotRange{{-0.2,1.2},{90,120}}];
In[]:=
plt1b=ListPlot[tbf1,PlotStyleRGBColor[0,0,0],PlotRange{{-0.2,1.2},{90,120}},JoinedTrue];
In[]:=
plt2b=ListPlot[tbf2,PlotStyleRGBColor[0,0,0],PlotRange{{-0.2,1.2},{90,120}},JoinedTrue];
In[]:=
a1=Show[plt1b,plt2b,plt1,plt2,FrameTrue,GridLinesAutomatic,PlotRange{{-0.025,1.025},{90,120}},ImageSize400{1,1},FrameLabel{Style["mole fraction (x & y)",16],Style["temperature in °C",16]},AspectRatio1]
Out[]=
In[]:=
tb5=Table[{x1[i],y1[i]},{i,1,100,2}];
In[]:=
tb6=Table[{xp1[i],yp1[i]},{i,1,27,2}];
In[]:=
tbf3=Sort[Join[tb5,tb6]];
In[]:=
plt3=ListPlot[tbf3,PlotStyle{Magenta,PointSize[0.0175]},FrameTrue,GridLinesAutomatic,PlotRange{{-0.025,1.025},{-0.025,1.025}},ImageSize400{1,1},FrameLabel{Style["liquid mole fraction ",16],Style["vapor mole fraction",16]},AspectRatio1];
In[]:=
tb5=Table[{x1[i],y1[i]},{i,1,100}];
In[]:=
tb6=Table[{xp1[i],yp1[i]},{i,1,27}];
In[]:=
tbf3=Sort[Join[tb5,tb6]];
In[]:=
plt3b=ListPlot[tbf3,PlotStyleRGBColor[0,0,0],JoinedTrue,FrameTrue,GridLinesAutomatic,PlotRange{{-0.025,1.025},{-0.025,1.025}},ImageSize400{1,1},FrameLabel{Style["liquid mole fraction ",16],Style["vapor mole fraction",16]},AspectRatio1];
In[]:=
a2=Show[plt3,plt3b,Epilog{Darker@Green,Line[{{0,0},{1,1}}]}]
Out[]=
Comparing with data from either Ref. 5 or Ref. 6 (displayed by green squares)
In[]:=
DATACHU={{x_water,y_water,Tboiling},{0.,0.,117.},{3.9,26.7,111.5},{4.7,29.9,110.6},{5.5,32.3,109.6},{7.0,35.2,108.8},{25.7,62.9,97.9},{27.5,64.1,97.2},{29.2,65.5,96.7},{30.5,66.2,96.3},{49.6,73.6,93.5},{50.6,74.0,93.4},{55.2,75.0,92.9},{56.4,75.2,92.9},{57.1,74.8,92.9},{57.3,75.0,92.8},{97.5,75.2,92.7},{98.0,75.6,93.0},{98.2,75.8,92.8},{98.5,77.5,93.4},{98.6,78.4,93.4},{98.8,80.8,93.7},{99.2,84.3,95.4},{99.4,88.4,96.8},{99.7,92.9,98.3},{99.8,95.1,98.4},{99.9,98.1,99.4},{100.,100.,100.}};
In[]:=
DATACHU//TableForm
Out[]//TableForm=
x_water | y_water | Tboiling |
0. | 0. | 117. |
3.9 | 26.7 | 111.5 |
4.7 | 29.9 | 110.6 |
5.5 | 32.3 | 109.6 |
7. | 35.2 | 108.8 |
25.7 | 62.9 | 97.9 |
27.5 | 64.1 | 97.2 |
29.2 | 65.5 | 96.7 |
30.5 | 66.2 | 96.3 |
49.6 | 73.6 | 93.5 |
50.6 | 74. | 93.4 |
55.2 | 75. | 92.9 |
56.4 | 75.2 | 92.9 |
57.1 | 74.8 | 92.9 |
57.3 | 75. | 92.8 |
97.5 | 75.2 | 92.7 |
98. | 75.6 | 93. |
98.2 | 75.8 | 92.8 |
98.5 | 77.5 | 93.4 |
98.6 | 78.4 | 93.4 |
98.8 | 80.8 | 93.7 |
99.2 | 84.3 | 95.4 |
99.4 | 88.4 | 96.8 |
99.7 | 92.9 | 98.3 |
99.8 | 95.1 | 98.4 |
99.9 | 98.1 | 99.4 |
100. | 100. | 100. |
Computing LLE data
Computing LLE data
We reproduce the figure below, which was given by Doherty et al. (Ref. 4). Minor discrepancies are most likely due to different thermodynamic data (i.e., NRTL and Antoine constants)
References
References
◼
J. M. Smith, H. C. Van Ness and M. M. Abbott, Introduction to Chemical Engineering Thermodynamics, 7th ed., Boston: McGraw-Hill, 2005.
◼
H. Renon and J. M. Prausnitz, “Local Compositions in Thermodynamic Excess Functions for Liquid Mixtures,” AIChE Journal, 14(1), 1968 pp. 135–144. doi:10.1002/aic.690140124.
◼
◼
M. F. Doherty, Z. T. Fidkowski, M. F. Malone and R. Taylor, Distillation, Section 13, Perry’s Chemical Engineer’s Handbook, 8th edition, NY: McGraw-Hill, 2008.
◼
J. C. Chu, R. J. Getty, L. F. Brennecke, and R. Paul, Distillation Equilibrium Data, NY: Reinhold, 1950.
◼
P. C. Wankat, Separation Process Engineering: Includes Mass Transfer Analysis, 3rd edition, Upper Saddle River: Prentice Hall, 2012.
CITE THIS NOTEBOOK
CITE THIS NOTEBOOK
Vapor-liquid and liquid-liquid equilibrium computations of a partially miscible binary system: 1-Butanol - water case
by Housam Binous & Ahmed Bellagi
Wolfram Community, STAFF PICKS, October 27, 2024
https://community.wolfram.com/groups/-/m/t/3308968
by Housam Binous & Ahmed Bellagi
Wolfram Community, STAFF PICKS, October 27, 2024
https://community.wolfram.com/groups/-/m/t/3308968