Define xyz point data
Define xyz point data
In[]:=
xyz=;
In[]:=
ListPointPlot3D[xyz,BoxRatios->Automatic,ImageSize->Large]
Out[]=

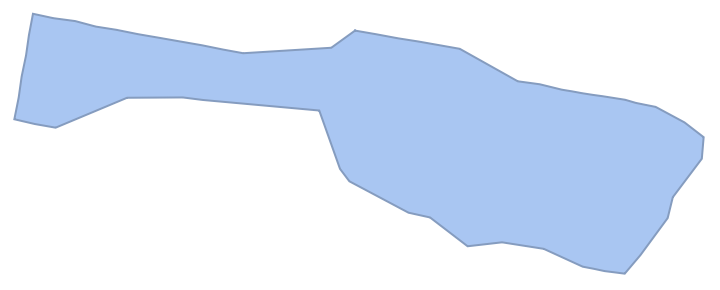
Get a suitable 2D (xy plane) boundary mesh for the point data
Get a suitable 2D (xy plane) boundary mesh for the point data
In[]:=
bm=BoundaryMesh[ConcaveHullMesh[xyz[[All,;;2]],22]]
Out[]=
In[]:=
RegionQ[bm]
Out[]=
True
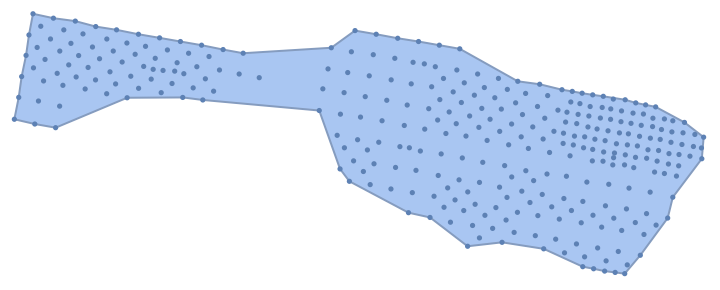
Show the boundary mesh together with xy points
Show the boundary mesh together with xy points
In[]:=
Show[bm,ListPlot[xyz[[All,;;2]]]]
Out[]=
Get RegionMemberFunction for the above boundary mesh
Get RegionMemberFunction for the above boundary mesh
In[]:=
rmf=RegionMember[bm]
Out[]=
RegionMemberFunction


Test the RegionMember Function
Test the RegionMember Function
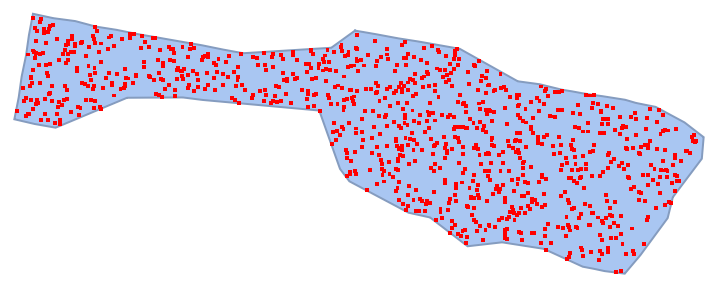
Test for points inside the region
Test for points inside the region
In[]:=
points1=RandomPoint[bm,1000];
In[]:=
Show[bm,ListPlot[{points1},PlotStyle->Red]]
Out[]=
In[]:=
rmf[points1]//Counts
Out[]=
True1000
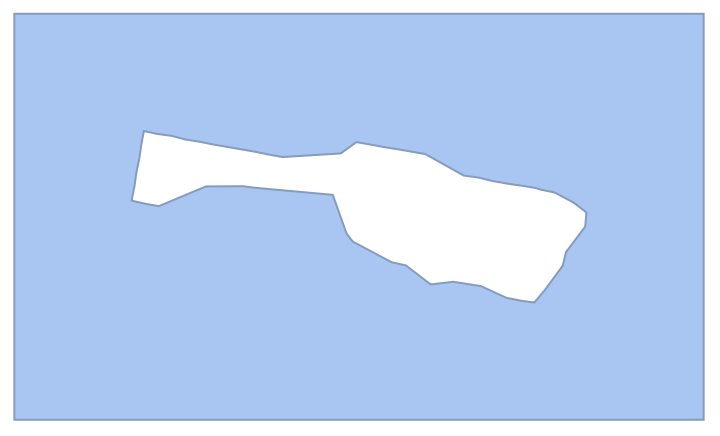
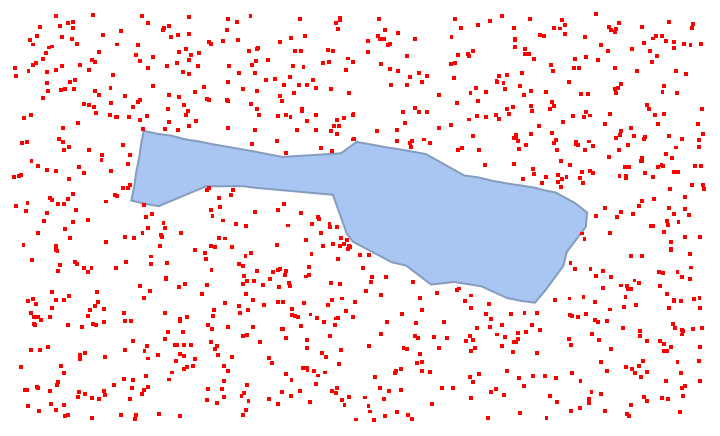
Test for points outside the region
Test for points outside the region
In[]:=
RegionDifference[Rectangle@@CoordinateBoundingBox[MeshCoordinates[bm],50],bm]
Out[]=
In[]:=
points2=RandomPoint[RegionDifference[Rectangle@@CoordinateBoundingBox[MeshCoordinates[bm],50],bm],1000];
In[]:=
Show[bm,ListPlot[{points2},PlotStyle->Red]]
Out[]=
In[]:=
rmf[points2]//Counts
Out[]=
False1000
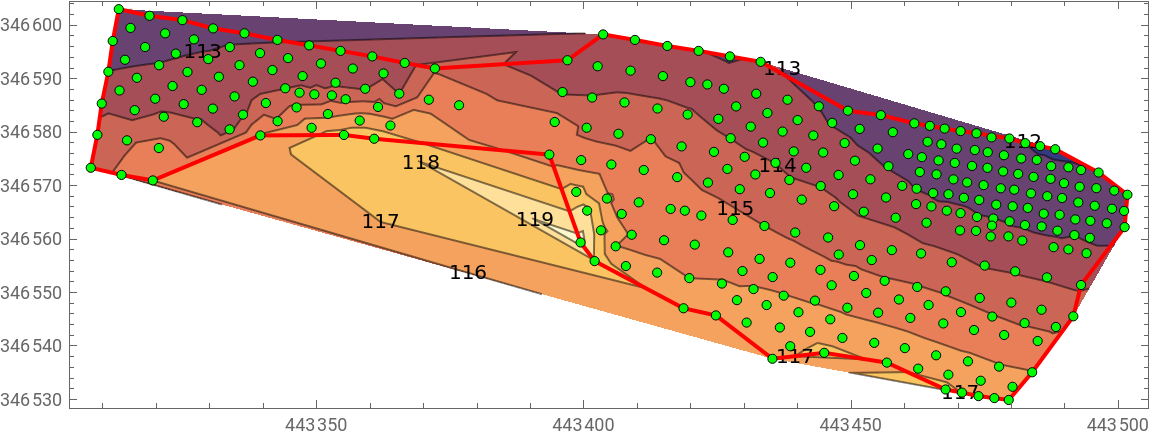
Contour the z values over the xy plane and confine contours to the region defined above
Contour the z values over the xy plane and confine contours to the region defined above
Attempting to exclude contours outside the region doesn’t seem to work as expected
Attempting to exclude contours outside the region doesn’t seem to work as expected
In[]:=
Show[ListContourPlot[xyz,ContourLabels->All,RegionFunction->Function[{x,y,z},rmf[{x,y}]]],Graphics[{EdgeForm[{Red,Thick}],FaceForm[None],bm}],ListPlot[xyz[[All,1;;2]],PlotMarkers->{Graphics[{EdgeForm[{Black,Thickness@Small}],FaceForm[Green],Disk[]}],Scaled[0.03]}(*,PlotStyle->Black*)],AspectRatio->Automatic,ImageSize->Large]
Out[]=

Using a different region to exclude the contours does, however, work as expected
Using a different region to exclude the contours does, however, work as expected
In[]:=
Show[ListContourPlot[xyz,ContourLabels->All,RegionFunction->Function[{x,y,z},RegionMember[Disk[RegionCentroid[bm],50],{x,y}]]],Graphics[{EdgeForm[{Red,Thick}],FaceForm[None],bm,EdgeForm[{Blue,Thickness@Medium}],FaceForm[None],Disk[RegionCentroid[bm],50]}],ListPlot[xyz[[All,1;;2]],PlotMarkers->{Graphics[{EdgeForm[{Black,Thickness@Small}],FaceForm[Green],Disk[]}],Scaled[0.03]}(*,PlotStyle->Black*)],AspectRatio->Automatic,ImageSize->Large]
Try pre-defining the RegionMemberFunction.
A workaround...
A workaround...
Try using a RegionMemberFunction that checks for points outside the region and then selects points that don’t return True (i.e. the point lies with the region).
Get the RegionMemberFunction.
Get the RegionMemberFunction.
Test for points inside the region
Test for points inside the region
Test for points inside the region
Test for points inside the region
Using this RegionMemberFunction in ListContourPlot works
Using this RegionMemberFunction in ListContourPlot works
Conclusion
Conclusion
Have I stumbled upon a bug?