The content of this post was originally a notebook for “Support materials for students of Phonetics” made by professor Francisco Lacerda, Department of Linguistics, Stockholm University.
Out[]=


Background and instructions
Background and instructions
Speech sounds are created by sound sources at the glottis and/or along the vocal tract. The pressure disturbances created by the sound sources propagate in the air contained in the vocal tract and are reflected at discontinuities in the propagation medium (like the vocal tract walls or its abrupt end at the lips). The reflection of the pressure disturbances (waves) results in the rhythmic bouncing, back and forth, of the acoustic energy. The acoustic energy is “trapped” in the vocal tract because of the very rhythmic bouncing, with a bouncing frequency that depends on how long the pressure disturbance travels along the vocal tract until it is reflected back. These bouncing frequencies are called resonance frequencies. Obviously, the longer the vocal tract, the longer the amount of time that the pressure wave takes the travel the vocal tract distance at a constant propagation speed. Longer distances mean longer travel times and therefore lower resonance frequencies. The vocal tract’s resonance frequencies (formants) are largely determined by its geometry,
When producing an oral vowel, the vocal tract can be seen as an acoustic tube that is closed at the glottis end (where the harmonic voice source is created) and open at the lips. If the tongue position is such that the vocal tract’s cross-sectional area is approximately constant, the vocal tract will be a quarter wavelength resonator (i.e. with resonance frequencies at odd multiples of c/(4*vt_length), where c is the speed of sound and vt_length is the vocal tract length.This configuration corresponds to a schwa-vowel. When the tongue moves to articulate another oral vowel, the cross-sectional area of the vocal tract increases in some places and decreases in others, influencing the original resonance frequency pattern in different ways, depending on where the widening or narrowing of the vocal tract occurs along its length (i.e. depending on the articulatory position). Thus, the vocal tract is a resonator with different resonance frequencies depending on the vowel’s articulatory gesture that will impact on the sound created by the harmonic voice source, at the glottis. In other words, the vocal tract functions as system of serially coupled filters that change the spectral characteristics of the sound generated by the voice source in much the same way as an equalizer changes the spectrum of the music being played by emphasizing selected frequency bands.
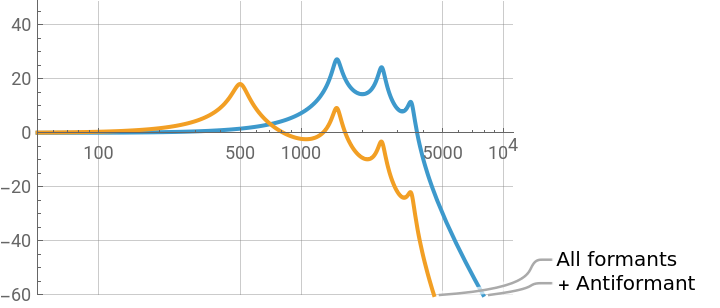
This model shows the vocal tract transfer function corresponding to different sets of formant frequencies (yellow curve). It allows also changing the formants’ bandwidths to study how they impact on the overall transfer function. The bandwidth indicates the width of the formant filter; the lower the bandwidth, the sharper the filter.
Note that formant filters have a general slope of -12 dB/octave for frequencies over the formant frequency.
The model also includes the simulation of a vocal tract with a side branch, like in the production of a nasal vowel or a lateral sound. In such cases anti-formants occur (i.e. upside-down formants indicating that the system damps acoustic energy at the anti-formant’s frequency). A formant and an anti-formant with exactly the same values cancel each other. This formants + anti-formant transfer function is shown by the blue line.
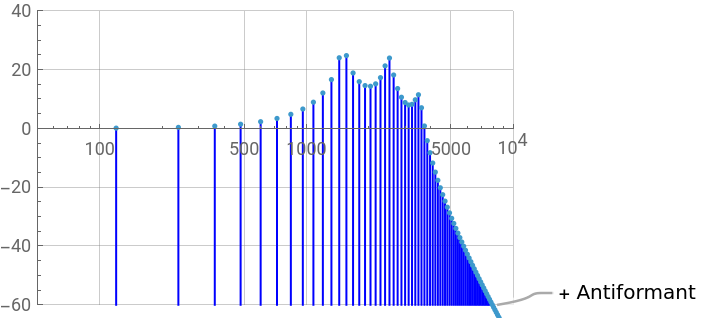
Finally, the model shows also the harmonic spectrum corresponding to the four-formant plus one anti-formant system (right plot). Note that when excited by a harmonic source, the sound radiated from the vocal tract does not directly reveal its underlying transfer function; instead the sound output is a series of harmonics whose relative amplitudes indirectly reveal the underlying transfer function shaping them.
Studying the characteristics of the vocal tract transfer function
Studying the characteristics of the vocal tract transfer function
■
Manipulating formant and anti-formant frequencies and bandwidths to observe how they impact on the transfer function
Manipulating formant and anti-formant frequencies and bandwidths to observe how they impact on the transfer function
◼
Variables
mindB, maxdB min and max values of the dB scalef0 source’s fundamental frequencyf1 ... b4 formant frequencies and bandwidthsfz , bz anti-formant frequency and bandwidth
◼
Manipulation suggestions
How does the harmonic spectrum change when f0 increases?
How well can the transfer function be inferred from the harmonic spectrum at different f0?
How are higher formant affected by frequency changes in a lower formant?
How is the transfer function affected by changes in the formant bandwidths?
Move the handles of f4, f3, f2 and fz to the right to set these frequencies as high as possible.
How many dB/octave does the transfer function for f1 alone fall near f1 frequency and at higher frequencies?
"Fetch" f2 to build a two-formants’ vowel visible in the A-F diagram.
How did the slope (dB/octave) of the new transfer function change for frequencies above f2?
Give the anti-formant the same frequency and bandwidth of f1 and observe what happens to the amplitude of f2 and to the slope at frequencies above it.
Set all the formants to maximum frequency values and set the anti-formant at fz about 600 Hz and bz to about 60 Hz. What is the slope of the anti-formant for frequencies above fz?
See output of the Manipulate above, on top of the post. Click on the + at the end of a slider to inspect or to give an explicit numerical value to the variable.