The Wolfram Emerging Leaders Program is a 4 month long project based program designed for gifted high school students to take a deep dive into a topic of their choice. Students work remotely in small groups to take their project from ideation to completion, with the guidance of Wolfram experts. Wolfram Emerging Leaders Program participants are selected from the Wolfram High School Summer Camp, which is open to talented, STEM oriented students age 17 and under.
This essay was written by:
This essay was written by:
Introduction
Introduction
We define political idea blocks as a particular grouping of unrelated political beliefs in populations. In the US, a well known political idea block is between gun control and abortion. Although completely unrelated subjects, if you are made aware of a US voter’s opinion on one subject, you can assume with some degree of accuracy what their opinion may be on the other.
Idea blocks (political in nature or not) are a basic and intrinsic element of every human community, self evident from a very early point in life. We seek to see if we can find signs of political idea blocks forming through simplistic political simulations.
If we find signs of political idea blocks emerging, we’re interested in understanding what specific factors of our simulation encourage these idea blocks.
Idea blocks (political in nature or not) are a basic and intrinsic element of every human community, self evident from a very early point in life. We seek to see if we can find signs of political idea blocks forming through simplistic political simulations.
If we find signs of political idea blocks emerging, we’re interested in understanding what specific factors of our simulation encourage these idea blocks.
Potential Applications and Uses for this Research
Potential Applications and Uses for this Research
Understanding how idea blocks in political environments form is very important to better understanding deeper elements of political science, voter manipulation, and voting trends internationally.
In a political environment, idea blocks are often used as a source of credibility. When introducing a topic of political interest to the general populous, a political driver may use their existing commonalities with whoever they’re speaking to to encourage them to believe in their new idea.
In a political environment, idea blocks are often used as a source of credibility. When introducing a topic of political interest to the general populous, a political driver may use their existing commonalities with whoever they’re speaking to to encourage them to believe in their new idea.
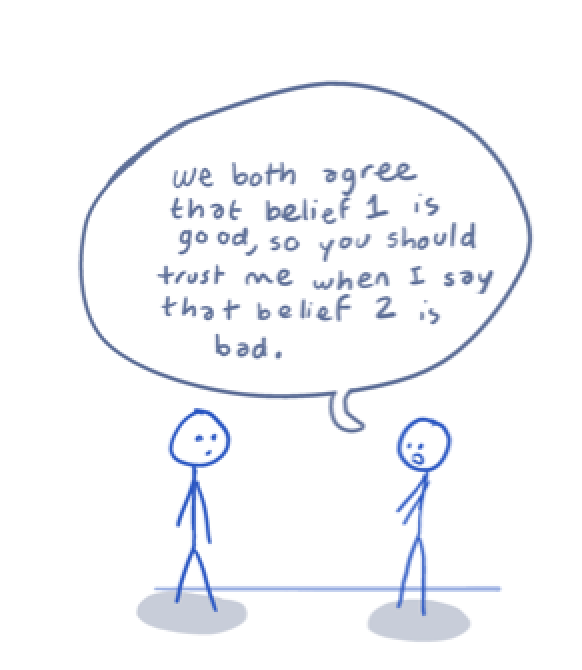
For example, a media company who has broadcasted a positive sentiment towards an arbitrary belief (let’s call it belief 1) may feel inclined to use that political leaning to convince their readers who also like belief 1 that belief 2 is bad.
Out[]=
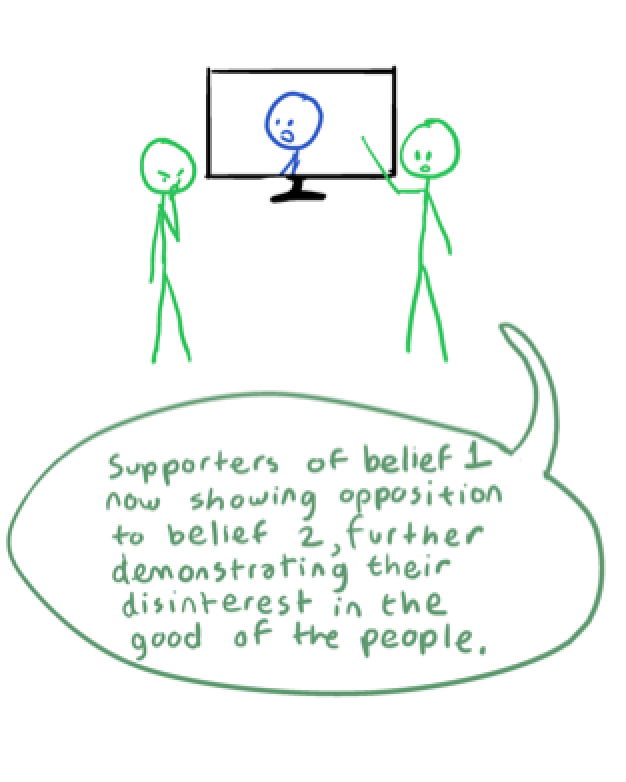
On the other hand, a media company or politician who does not agree with belief 1 may use it as evidence to say that belief 2 is good.
Out[]=
At its core, manipulation of idea blocks can be simplified to “Using people’s desire to fit in to political advantage.” In a complex political environment, this simple mechanism can be used to create polarization, distrust in media, and breakdown of democratic principles; although it is much more often used for small political gains.
As a group, we believe that political idea blocks and manipulation of these is the main driving force behind most political change. We do not see the practice of manipulating idea blocks for political gain as intrinsically good nor bad, we see it instead as a truth of human society.
This brings about a bit of a chicken and the egg problem though: do idea blocks form as a result of intent to manipulate them, or does the tactic of manipulation of idea blocks occur as a result of idea blocks themselves?
They seem to be self-reinforcing concepts, with tighter associations between beliefs making for more compelling arguments based around existing blocks, making for tighter idea blocks, and so on. This question may not have an answer, as we suspect the truth is probably a combination of both.
But this in itself brings up another compelling problem; that if idea blocks become too tight they could prevent most people within their respective idea blocks from considering anything outside of it, hence making them extremely vulnerable to misinformation or manipulation of interest.
An interesting allusion to this problem is shown in a quote by Donald Trump from a 2016 campaign rally in Iowa: “[Pollsters] say I have the most loyal people... Where I could stand in the middle of Fifth Avenue and shoot somebody and I wouldn’t lose any voters.”
As a group, we believe that political idea blocks and manipulation of these is the main driving force behind most political change. We do not see the practice of manipulating idea blocks for political gain as intrinsically good nor bad, we see it instead as a truth of human society.
This brings about a bit of a chicken and the egg problem though: do idea blocks form as a result of intent to manipulate them, or does the tactic of manipulation of idea blocks occur as a result of idea blocks themselves?
They seem to be self-reinforcing concepts, with tighter associations between beliefs making for more compelling arguments based around existing blocks, making for tighter idea blocks, and so on. This question may not have an answer, as we suspect the truth is probably a combination of both.
But this in itself brings up another compelling problem; that if idea blocks become too tight they could prevent most people within their respective idea blocks from considering anything outside of it, hence making them extremely vulnerable to misinformation or manipulation of interest.
An interesting allusion to this problem is shown in a quote by Donald Trump from a 2016 campaign rally in Iowa: “[Pollsters] say I have the most loyal people... Where I could stand in the middle of Fifth Avenue and shoot somebody and I wouldn’t lose any voters.”
Out[]=
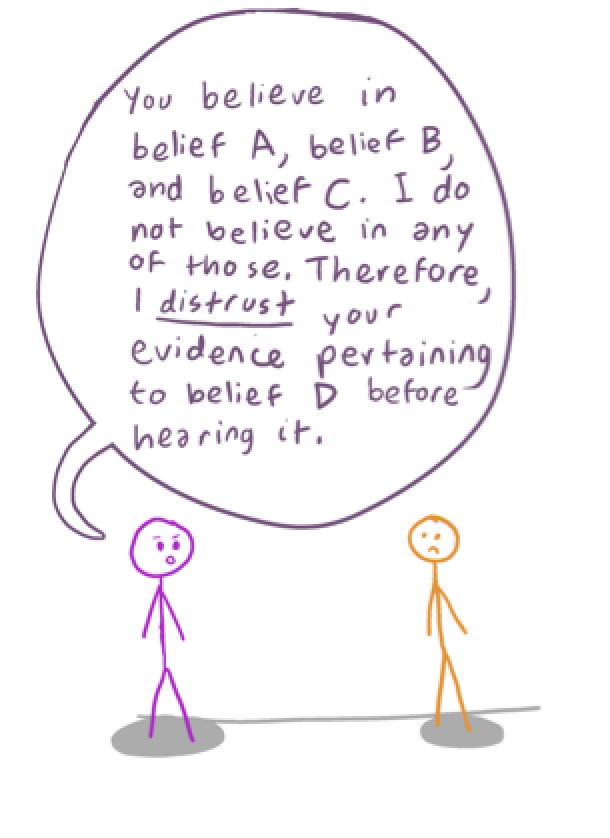
Extremely tight idea blocks in a democratic political environment are objectively bad for all groups involved as it can limit expression of political nuance and prevent cooperation between parties as voters within given blocks aren’t willing to compromise or change their opinions. Ability to pass favorable policy for the voter may become less important to the voter. Instead a politician’s loyalty to the voter’s respective idea block may become the voter’s primary deciding factor when voting, reducing the process of voting to a tribalistic and highly ineffective practice in the long run. Focus on a politician’s loyalty to a specific group over a politician’s success in passing useful and beneficial policy nullifies the importance of democratic government as a body focused on enacting the will of the people.
Regardless of whether idea blocks in a political environment are tight or loose, idea blocks in general prevent people from making entirely independent decisions, as it influences them to make decisions according (in part) to the opinions of others.
This can lead to voters making decisions partially divorced from fact or the objective advantage each particular voter may gain from policy (see footnote). Making political decisions in part influenced by the opinions of others is entirely unavoidable as humans, and therefore there is no such thing as a political environment with no idea blocking. We don’t know enough to say whether this is good or bad, simply that it’s a part of every human democracy.
Understanding how idea blocks in a political environment develop and understanding what conditions may cause them to become stagnant or diverse can help us better understand how governments can be poised to best encourage independent policy decisions by individual voters and hence create a more democratic and fair political environment under their respective government.
Regardless of whether idea blocks in a political environment are tight or loose, idea blocks in general prevent people from making entirely independent decisions, as it influences them to make decisions according (in part) to the opinions of others.
This can lead to voters making decisions partially divorced from fact or the objective advantage each particular voter may gain from policy (see footnote). Making political decisions in part influenced by the opinions of others is entirely unavoidable as humans, and therefore there is no such thing as a political environment with no idea blocking. We don’t know enough to say whether this is good or bad, simply that it’s a part of every human democracy.
Understanding how idea blocks in a political environment develop and understanding what conditions may cause them to become stagnant or diverse can help us better understand how governments can be poised to best encourage independent policy decisions by individual voters and hence create a more democratic and fair political environment under their respective government.
Out[]=
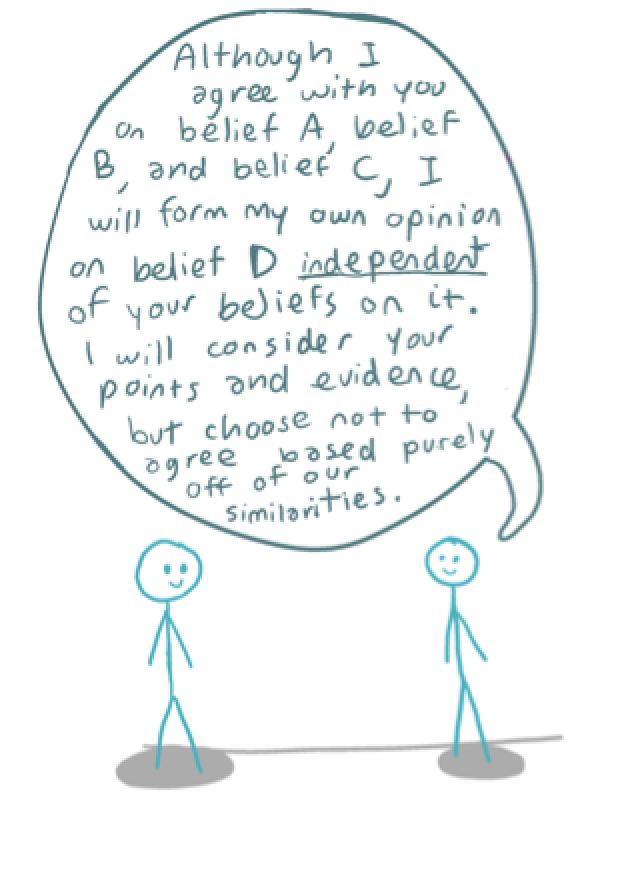
Beyond the forming of idea blocks, our research may be able to broadly understand some differences in voter patterns between governments with varying levels of democracy. We do not guarantee, or specifically aim for this result in our project though, so any findings of this kind would likely be anecdotal.
Footnote: We recognize that positive collective intelligence or “symbiotic intelligence” can lead to a better result (as attuned to the needs of those within the idea block) from an idea block than would occur if those within the idea block were completely divorced from the beliefs of those within their respective idea block, but this is not always the case and the question of how often it is advantageous and in what circumstances is it advantageous in a democratic system is contentious in the scientific community.
We don’t claim to know the answer, or to be able to discover it with our simulation (which is interested in the formation of idea blocks and their behavior over time). However, it’s important to note that we believe that idea blocks cease to function with their intended purpose of collective intelligence once they become so tight that members of each idea block will not respect or listen to the ideas of those in other idea blocks.
We don’t claim to know the answer, or to be able to discover it with our simulation (which is interested in the formation of idea blocks and their behavior over time). However, it’s important to note that we believe that idea blocks cease to function with their intended purpose of collective intelligence once they become so tight that members of each idea block will not respect or listen to the ideas of those in other idea blocks.
Initialization for Upcoming Graphs (aka Pandora’s Box- There are a lot of lists stored here, open at your own risk!)
Key Parts of the Simulation
Key Parts of the Simulation
Going into the project, we quickly realized how simple it would be to over complicate this simulation, and attempted to place a focus on making it relatively simplistic and easy to understand. We decided on five political motivating factors, each with simplistic relationships with one another. They are defined as the following:
For simplicity, all groups are assumed to know the specific beliefs of all other groups in the system. There is no “changing face for the public”.
Voters
Voters
These represent the main body of the simulation, and are the only group within the simulation who are able to influence the results of elections. They are directly impacted by politicians and media, while political parties and influencers only have an indirect effect on their views.
Politicians
Politicians
Politicians are the items in the simulation that voters directly vote for. Voters decide which to vote for by taking the absolute value of the difference between each of the respective Politician’s beliefs and theirs individually, and taking the mean of all of the differences, doing that for all other running Politicians, and then voting for whichever Politician has the smallest mean difference. Politicians are directly impacted by Influencers, their respective Party, and optionally, the Media. They are not directly impacted by Voters.
The reason we decided that Politicians would not be directly impacted by Voters in our simulation is because real-life politicians are only ever directly impacted by the beliefs of a very small amount of the voting population; who they come in contact with and have the chance to speak with. We could've made it so that a small group of Voters impacted Politicians, but this feels unnecessary and takes away from the intent of simplicity.
Politicians are still impacted by the collective wants of the people who have a meaningful chance of voting for them, but in our simulation this comes through the influence of parties.
Parties
Parties
Parties act as a strategic center to their respective politicians, and mostly serve as a way to stabilize idea blocks (much like in real political environments.) Every turn, if their politician won the election they update their beliefs to be more similar to the politician’s beliefs, and they update their beliefs slightly to appeal more to fringe voters (voters who nearly voted for that party’s politician) in that turn’s election. They can optionally be directly affected by Influencers as well. By default this is turned off.
Media
Media
The media in our simulation directly impacts voters and optionally politicians. By default “Media affects Politicians?” is turned off. Media is impacted by Influencers, Parties, and optionally Voters.
Unlike other motivating factors, Media are treated less like a numerical set of beliefs (although they are assigned a belief pool) and more like an amplifier or muffler to a person's existing beliefs, depending on the initial settings.
We have broadly categorized Media types into three groups which are explained more in detail in the options index portion of the simulation.
We have broadly categorized Media types into three groups which are explained more in detail in the options index portion of the simulation.
Our three are broadly defined as:
1. "Informative": Brings voters slightly closer to neutral on every belief after each turn; makes it harder for people to radicalize or form tight idea blocks.
2. “Polarizing”: Makes voters slightly more inclined to their own side of each belief after each turn; makes it easier for people to radicalize or form tight idea blocks.
3. “One-Sided”: Makes voters slightly more inclined to a very specific set of beliefs after each turn, defined by whichever party wins the first round; we’re not quite sure how this pans out in our simulation since our simulation doesn’t attempt to simulate extremely biased or one-party governments.
Influencers
Influencers
This group is well described as a simulated-equivalent to lobbyists. In our simulation they have only one particular political belief which they believe very strongly in, and the others are just decided by what is most favorable to get their primary belief to be enacted in policy (this means adapting to existing idea blocks).
In our simulation, there is only one Influencer with one randomly generated "primary belief" that is set to some extreme. The rest are made to conform to whichever idea block their primary belief is closest to.
Although technically all but one of their beliefs is recalculated every turn according to the interests of the voters who are likely to vote for their primary belief, we label Influencers as not being affected by any group since at least one of their beliefs is entirely stagnant.
Setting up the Simulation
Setting up the Simulation
Now that we have some set groups, ideas, and objects for our project, we can begin having these groups interact in a way that simulates a political system.
At the beginning of the simulation, important variables are inputted by the user. Many of these are self-explanatory, but one variable to note is Media type -- with values of 1, 2, and 3 representing informative, polarizing, and biased media respectively as explained in the previous section.
There is further explanation on each of these specifically in the associated code file. The below panel isn’t live, so it won’t work when you press buttons! Look at the full code file if you’d like to run the simulation yourself.
At the beginning of the simulation, important variables are inputted by the user. Many of these are self-explanatory, but one variable to note is Media type -- with values of 1, 2, and 3 representing informative, polarizing, and biased media respectively as explained in the previous section.
There is further explanation on each of these specifically in the associated code file. The below panel isn’t live, so it won’t work when you press buttons! Look at the full code file if you’d like to run the simulation yourself.
StartingPanel
Out[]=
Initialization
Initialization
At the start of the simulation, each Voter is assigned a random value of -1 to 1 on given beliefs, representing how much they agree or disagree with that belief.
Some number of Parties and Politicians are generated by the same method. Politicians are then "assigned" to the party that most closely matches their personal beliefs.
Of course, in the real world it is possible for people to affiliate with a party that doesn't have the strongest match with their beliefs for a number of reasons, but that scenario is not accounted for to maintain simplicity.
Voting
Voting
In each turn of the simulation, each voter in the simulation chooses a party based off their belief values and those of each party.
Inside each party, voters also choose the candidate with beliefs most similar theirs and a primary election is run. The candidate with the most votes from each party advances as that party's representative to the general election. In the general election, voters again vote for the candidate that most closely matches their beliefs, though it is important to note that they don't have to vote for the candidate from their party.
The full results of an election are printed out as a list with the belief values of the politician who won, and the index of their corresponding party. Results for each turn are stored in a mega-list containing the results and current state of each of the five political motivating factors for each turn that's run.
Influences Between Groups
Influences Between Groups
One of the key processes that happen in each turn of the simulation is the belief values of each group changing slightly based on influences from other groups. Whether or not some of these influences happen depend on the values that the simulation was initialized with.
Influence Distribution
Influence Distribution
Many of the relation functions in our simulation center around our “Influence Distribution”, which essentially is just an intuitive way of understanding how people may influence one another.
Say, for example, Person A just learned of Person B's beliefs. If a belief of Person A is similar to that of Person B, Person A may change that belief to be closer to that of Person B's, while if Person A strongly disagrees with Person B, Person A may become more strongly entrenched in their view.
The following graph shows how much, on a relative scale, Person A's view changes towards Person B's view if Person A and Person B are on the X and Y axes in our simulation. This, of course, is not expected to perfectly model real life, it's meant to be a bit of a rough guess.
Some relationships use the Influence Distribution, whilst others don’t based on what makes sense in the specific relationship. For example, all forms of media excluding Media 3 (this option represents a media environment that exclusively favors one point of view, and may be highly polarizing to those who are already against it) don’t work with the Influence Distribution.
Politicians on Parties
Politicians on Parties
Politicians who win the election for their party change the belief of their party towards their own views according to the Influence Distribution.
Parties on Politicians
Parties on Politicians
Parties will influence any politicians who are affiliated with them by the Influence Distribution.
This can be seen as a realistic equivalent to a strategic hub for politicians, as politicians in the real world often change their views to conform more with their parties standards when running for election so as to attract more voters.
This is the idea we had in mind when coding for Parties' influence on Politicians.
People on Parties
People on Parties
Parties use a unique strategy when changing to fit the views of more people.
Each individual party first finds all people who are on the verge of two parties (one of them being the party running the code currently.)
Then, they find of those, which did not vote for them.
Then they take the mean of each of the Voter's beliefs and subtract it from their own belief value for each belief.
They then find which difference is the furthest from zero (on average) and the party moves its agenda on that respective belief slightly towards the average of those "fringe" voters.
We may change this formula to be more optimized while still remaining realistic to the capabilities of real political strategy in the future.
Politicians on People
Politicians on People
Politicians use the Influence Distribution to influence voters. This is because we believe that politicians who are very different from certain voters may actually polarize them from their cause, while politicians who are similar to voters may make those voters’ opinion closer to their own.
As we mentioned earlier, in the simulation a politicians outward policy interests are the same as their internal ones.
Media on People and Politicians
Media on People and Politicians
As described earlier, an informative media draws people more towards a centrist view, a polarizing media makes people more extreme over time, and a biased media pulls people towards whoever won the first election.
Media can affect politicians when this option is turned on, but by default we have it turned off because we don't think that most real-life politicians are directly affected by what is put on the news as much as they are by what their constituents think (which can indirectly make politicians affected by the media.)
Influencers on Media
Influencers on Media
Influencers impact the media linearly, bringing them slightly closer to their own views every turn. This does not mean that the Media will inevitably become the same as the Influencer though, as it is affected by other groups. In addition, the user can turn down the impact of influencers such as to dim this effect.
Influencers on Politicians
Influencers on Politicians
Influencers impact Politicians a bit differently- a linear impact is multiplied times 1.5 minus the absolute value of the difference between the key belief of the influencer, and the corresponding belief of the politician.
This makes it so if the difference is more than 1.5, a politician will deviate further away from the influencer as a response.
It also means that politicians that are already close to the influencer on their primary belief will swing towards them faster in all beliefs. This also means that from the start, about 3/4 of existing politicians will gravitate towards the influencer to some degree.
This is a similar effect to our Influence Distribution, but works out a little differently in that fewer politicians will move further from the ideas of the Influencer as a result.
We feel that this is realistic because most people are likely more forgiving to differences in ideology when large donations sweeten the pot, but this is just an assumption.
Politician Renewal
Politician Renewal
It would be unrealistic if politicians got to run in 100 presidential elections, so politicians are removed and replaced with semi-randomly generated politicians depending on the user’s preset settings.
The default settings are set to the below, meaning that if the default setting were run, a Politician would get replaced with a randomly generated Politician if they have run five times.
At the beginning of the simulation, all Politicians are given a random number of "run times" between 0 and the max so that they're not all suddenly replaced at once when t=max. Also, when Politicians are replaced they are replaced with a Politician whose preset beliefs are RandomReal[{-0.5,0.5}] away from each of a randomly chosen Party's beliefs.
The function used for Politician Renewal is shown below the preset options.
Methods of Analysis
Methods of Analysis
Our primary interest in this simulation is finding the formation of idea blocks- and there are many ways for us to observe these. In our simulation we provide many options for viewing data from a run. Below you can see the panel used for data visualization and testing. Soon it will also be able to show the default settings used to create a particular run.
3D Dot Plot
3D Dot Plot
Possibly the most useful plot on this list, the 3D dot plot allows us to view the groupings of 3 beliefs at once with all voters, and view the beliefs of the other four groups, if we so choose.
Like all other graph options, the plot is run in an Animate[], which means that you can view the progression of the plot over the course of the simulation just by pressing a button.
Because this particular graph is 3D, it can also be rotated while the animation is paused by clicking and holding on the prism. Here are some examples of 3D dot plots in use.
The slider on the Animate[] function indicates time. We have used GIFs of these objects so that the notebook works smoothly in the cloud. If you download your own copy of the notebook and run the code, you will get an actual Manipulate.
The above plot shows politicians quickly clustering around their respective parties as voters converge slowly to the center of the plot. One of the parties doesn’t move much, which could indicate a lot of things that we would have to look at other graphs to better understand.
This plot was produced under all default settings, which includes the setting for Media Type 1: Informative, which seeks to prevent polarization. Clearly, this setting did its job.
This plot was produced under all default settings, which includes the setting for Media Type 1: Informative, which seeks to prevent polarization. Clearly, this setting did its job.
This plot shows more movement from both parties than the last, and shows a general motion of all voters towards one side.
The voters closer to the side appear to move faster towards it. This plot was produced with all default setting except for Media Type, which set to 2: Polarizing. Interestingly enough, although all points move towards one side, they do it at different paces.
It is interesting that in a media setting made to make voters move closer towards their own beliefs, all move towards one. Of course, the media’s influence isn’t the only factor at play here, but either way we found this result quite fascinating.
This could mean that the Media 2 setting in tandem with the influences of other groups naturally creates a flow to one side of the graph.
One important point to mention is that in this particular simulation, the Influencer’s chosen “extreme” belief was located in Belief 1, which is displayed as one of the axes on the graph. But there were not only voters on one extreme of the Belief 1 = 1.0 plane, but also voters on one extreme of the Belief 2 = 1.0 and Belief 3 = 1.0 planes, so it can’t be due to that influence alone.
Interestingly, there were no voters located on any of the other extreme planes.
The voters closer to the side appear to move faster towards it. This plot was produced with all default setting except for Media Type, which set to 2: Polarizing. Interestingly enough, although all points move towards one side, they do it at different paces.
It is interesting that in a media setting made to make voters move closer towards their own beliefs, all move towards one. Of course, the media’s influence isn’t the only factor at play here, but either way we found this result quite fascinating.
This could mean that the Media 2 setting in tandem with the influences of other groups naturally creates a flow to one side of the graph.
One important point to mention is that in this particular simulation, the Influencer’s chosen “extreme” belief was located in Belief 1, which is displayed as one of the axes on the graph. But there were not only voters on one extreme of the Belief 1 = 1.0 plane, but also voters on one extreme of the Belief 2 = 1.0 and Belief 3 = 1.0 planes, so it can’t be due to that influence alone.
Interestingly, there were no voters located on any of the other extreme planes.
Correlation Matrix 1
Correlation Matrix 1
The first matrix is exactly what it says it is: a matrix of correlation coefficients by the Pearson Correlation formula. It is symmetrical, because order does not matter when evaluating for correlation.
Because we don’t expect idea groupings in most circumstances to form around a line, this matrix may not be particularly helpful in most situations, but we offer it as an option to provide additional information about run data. The use may not be obvious at the moment, but could crop up with more testing.
Because we don’t expect idea groupings in most circumstances to form around a line, this matrix may not be particularly helpful in most situations, but we offer it as an option to provide additional information about run data. The use may not be obvious at the moment, but could crop up with more testing.
As before, the top animation was run with default setting (including Media 1: Informative) and the bottom was run with default setting (apart from the non-default setting, Media 2: Polarizing).
As we mentioned earlier, we’re not entirely sure of the use of this function, but interestingly the correlation values are much more constant with Informative settings media when contrasted to the more volatile Polarizing media setting.
This was an unexpected result that we’re excited to delve further into with more testing.
As we mentioned earlier, we’re not entirely sure of the use of this function, but interestingly the correlation values are much more constant with Informative settings media when contrasted to the more volatile Polarizing media setting.
This was an unexpected result that we’re excited to delve further into with more testing.
Correlation Matrix 2
Correlation Matrix 2
This matrix technically isn’t a correlation matrix by the mathematical definition, but maybe by the dictionary definition. This matrix does not show correlation coefficients between beliefs, but instead finds the mean of the second belief for voters who have a belief between 0 and 1 for the first belief.
For example: For every point on this matrix- take (1,4)- all people with positive beliefs for 1 are recorded, and then the average of their beliefs on 4 are taken. Numbers on the matrix that are far from zero may indicate a high correlation between the given beliefs. The matrix is not symmetrical, however, because of the nature of the test.
The main shortcoming of this plot is that although these numbers may indicate a strong relationship between two beliefs, they don’t do much more than indicate. This plot is a good one to use if you want to know which belief pairs to watch for in other plots, but not if you want to make any actual conclusions.
All cells here appear to remain around zero for the entire run. Some increased slightly over the period while others decreased slightly.
This would indicate that a lot of idea grouping may not be happening under these settings, which as we discussed in our “Potential Applications” is (hypothetically at least) a good thing for a democracy. It would make sense if a better democratic environment is created under a Informative media environment as opposed to a polarizing one.
However, the fact that these results indicate that little to no idea grouping is happening at all could also concerning for the integrity of our simulation. We also mentioned in our “Potential Applications” section that idea grouping is unavoidable in any human society, so if there were no idea grouping occurring in our simulation that would be a point of concern.
Like mentioned before, these results do not necessarily indicate anything, especially if Voters tend to hover around zero (which, from our previous simulations you can see that they do in Media 1.)
So these results are not necessarily bad, but they’re also not necessarily good. They could either mean that idea grouping occurs to some extent, but it happens with values near zero, it could mean that idea grouping is infrequent to a point of concern, or it could be a combination of both.
One test alone is not enough to decide that for sure, and that’s why all of the provided test options are necessary to make interesting conclusions.
This would indicate that a lot of idea grouping may not be happening under these settings, which as we discussed in our “Potential Applications” is (hypothetically at least) a good thing for a democracy. It would make sense if a better democratic environment is created under a Informative media environment as opposed to a polarizing one.
However, the fact that these results indicate that little to no idea grouping is happening at all could also concerning for the integrity of our simulation. We also mentioned in our “Potential Applications” section that idea grouping is unavoidable in any human society, so if there were no idea grouping occurring in our simulation that would be a point of concern.
Like mentioned before, these results do not necessarily indicate anything, especially if Voters tend to hover around zero (which, from our previous simulations you can see that they do in Media 1.)
So these results are not necessarily bad, but they’re also not necessarily good. They could either mean that idea grouping occurs to some extent, but it happens with values near zero, it could mean that idea grouping is infrequent to a point of concern, or it could be a combination of both.
One test alone is not enough to decide that for sure, and that’s why all of the provided test options are necessary to make interesting conclusions.
The above animation shows the majority of the cells going from being near zero (what we would expect when all variables are randomized) to the majority of cells rising above 0.25.
This is a strong indication that idea grouping/clustering may be occurring, and indicates to us that we might want to check the cluster/party graphs of cells with particularly high numbers.
This fits with our previous observations about the clustering that occurs under Media 2.
This is a strong indication that idea grouping/clustering may be occurring, and indicates to us that we might want to check the cluster/party graphs of cells with particularly high numbers.
This fits with our previous observations about the clustering that occurs under Media 2.
Cluster & Party 2D Plots
Cluster & Party 2D Plots
In this function we are able to see two separate graphs at once, side-by-side to compare how the KMedoids formula would expect voters to cluster versus how they actually group.
The KMedoids formula was chosen as a cluster-finder because we found it to be most accurate in our tests, but we plan to add an option to use different formulas.
It’s important to note that these only show two beliefs, and that party groups are established on a combination of shared beliefs, and not just one or two.
Therefore, it’s not realistic to directly compare the cluster map to the simulation map and expect that they must be very similar; instead we should look to for similar features to make conclusions about the nature of the idea groupings, ideally by looking at multiple belief pairings.
The KMedoids formula was chosen as a cluster-finder because we found it to be most accurate in our tests, but we plan to add an option to use different formulas.
It’s important to note that these only show two beliefs, and that party groups are established on a combination of shared beliefs, and not just one or two.
Therefore, it’s not realistic to directly compare the cluster map to the simulation map and expect that they must be very similar; instead we should look to for similar features to make conclusions about the nature of the idea groupings, ideally by looking at multiple belief pairings.
The first thing we noticed when looking at this graph was how few members of Party 1 there appear to be in this run. Because there were few from t=0, it could just be bad luck, but the fact that those existing members dwindle instead of increase was unexpected for us.
This could indicate that our chosen settings may by nature just lead to an unbalanced result, that the way we’ve coded the party changes is flawed, or something else entirely.
This result would indicate that Party 2 probably won all elections in the run, but we can check to see if that’s the case in our Winners’ Line Plot.
Apart from that observation, this graph only showed us what we could see from one of the sides of the 3D plot anyway. It’s safe to say that this graph is probably much more useful when party affiliations are more evenly distributed.
This could indicate that our chosen settings may by nature just lead to an unbalanced result, that the way we’ve coded the party changes is flawed, or something else entirely.
This result would indicate that Party 2 probably won all elections in the run, but we can check to see if that’s the case in our Winners’ Line Plot.
Apart from that observation, this graph only showed us what we could see from one of the sides of the 3D plot anyway. It’s safe to say that this graph is probably much more useful when party affiliations are more evenly distributed.
Since this graph shows the same strange pattern as the above one, it’s worth mentioning with what we think is the cause and whether or not the right decision is to fix it.
After seeing these two graphs initially, we were worried we had made a mistake in our code to warrant two runs with entirely different randomized initial belief values to have such a similar Party distribution, but we realized that this is largely because there are only two parties at the start.
Because all Voters are randomized at the beginning of the run, their collective beliefs all average around 0, which essentially means that whichever party starts out closer to zero has a significantly larger slice of the pie than the other party in a two party system.
Unless both parties have the same distance from zero, there’s a good chance that one of them will get significantly more than the other.
The part about why it just gets more unbalanced as time goes on though doesn’t have a clean explanation, and probably either has to do with some setting that isn’t ideal for what we want to simulate, or we coded something in a way that didn’t allow for party flexibility.
Although we can’t really prove our hypothesis mentioned earlier about party distribution, we did try the same thing with a three party system (albeit with less voting turns, but that doesn’t impact initial conditions) and immediately got a much more balanced result that actually had clear similarities to the cluster map. Here’s the graph below:
After seeing these two graphs initially, we were worried we had made a mistake in our code to warrant two runs with entirely different randomized initial belief values to have such a similar Party distribution, but we realized that this is largely because there are only two parties at the start.
Because all Voters are randomized at the beginning of the run, their collective beliefs all average around 0, which essentially means that whichever party starts out closer to zero has a significantly larger slice of the pie than the other party in a two party system.
Unless both parties have the same distance from zero, there’s a good chance that one of them will get significantly more than the other.
The part about why it just gets more unbalanced as time goes on though doesn’t have a clean explanation, and probably either has to do with some setting that isn’t ideal for what we want to simulate, or we coded something in a way that didn’t allow for party flexibility.
Although we can’t really prove our hypothesis mentioned earlier about party distribution, we did try the same thing with a three party system (albeit with less voting turns, but that doesn’t impact initial conditions) and immediately got a much more balanced result that actually had clear similarities to the cluster map. Here’s the graph below:
The fact that party distribution is extremely skewed from the start in two-party systems isn’t necessarily a concern for us as long as it quickly redistributes to have a fairer distribution, as we would expect of it in a real political system.
The idea that when a two-party system comes about in the real world, one of the parties is far less popular doesn’t seem unrealistic to the point that it would warrant us scrapping the way parties are made, but we will consider making an option for the user to have fairer party distributions from the start when selecting a two party system.
Long story short, we don’t plan on changing the way parties are made, but we are concerned with how it fails to redistribute over time.
The idea that when a two-party system comes about in the real world, one of the parties is far less popular doesn’t seem unrealistic to the point that it would warrant us scrapping the way parties are made, but we will consider making an option for the user to have fairer party distributions from the start when selecting a two party system.
Long story short, we don’t plan on changing the way parties are made, but we are concerned with how it fails to redistribute over time.
Point Plot & Linear Fit
Point Plot & Linear Fit
Like we said before, we don’t really expect idea groupings to form along a line with most settings. That seems unlikely to happen, so creating a line-shaped-idea-grouping-finder wasn’t our goal when we created this plot as an option.
Instead, what lines can offer us is seeing how symmetrical or skewed one side a graph is, and also help us discern the shape of its distribution on the coordinate plane, especially for runs with larger numbers of Voters.
Instead, what lines can offer us is seeing how symmetrical or skewed one side a graph is, and also help us discern the shape of its distribution on the coordinate plane, especially for runs with larger numbers of Voters.
Hypothetically, if a graph is perfectly symmetrical there will be a y=0 line in the graph. What you will find is that at t=0, the line on the graph is almost always close to that line because all voters are generated randomly, and then it moves in correspondence with your inputted settings.
The line for this particular graph stays fairly straight but gains a more negative slope as t increases. This indicates to us that although runs with Media 1 may seem to just converge, they might also become more irregular with time.
This idea would have to be supported with many runs of the same settings before it could hold any weight at all, but the idea is interesting, especially considering how regular all of the other graphs portrayed the default Media 1 settings to be.
The line for this particular graph stays fairly straight but gains a more negative slope as t increases. This indicates to us that although runs with Media 1 may seem to just converge, they might also become more irregular with time.
This idea would have to be supported with many runs of the same settings before it could hold any weight at all, but the idea is interesting, especially considering how regular all of the other graphs portrayed the default Media 1 settings to be.
It’s hard to tell whether the slope of this graph decreased, increased, or stayed the same just by looking at the graph, but it obviously was translated quite a bit upwards.
If the slope isn’t changing, that might mean that most points (regardless of their location on the grid) are moving at the same pace towards some unknown value. This is good info to inform us of specific voter patterns in this run.
If the slope isn’t changing, that might mean that most points (regardless of their location on the grid) are moving at the same pace towards some unknown value. This is good info to inform us of specific voter patterns in this run.
Winners’ Line Plot
Winners’ Line Plot
This plot is the most simple of them all. It simply prints a number line with a point for every turn that occurred during a run, and each point is colored according to the party that won and labeled according to the politician that won.
Remember! Politicians do get replaced after a certain amount of turns (predetermined by the user) so if you see that Politician #30 won at t=24 and at t=73, they’re probably not the same politician, and may not even fall under the same party.
This plot is useful because it helps us get a big-picture idea of how all the idea groupings, trends, and patterns we noticed with the other graphs actually came together in the results.
Remember! Politicians do get replaced after a certain amount of turns (predetermined by the user) so if you see that Politician #30 won at t=24 and at t=73, they’re probably not the same politician, and may not even fall under the same party.
This plot is useful because it helps us get a big-picture idea of how all the idea groupings, trends, and patterns we noticed with the other graphs actually came together in the results.
Considering the party distribution we saw in the Cluster/Party plots from earlier, this result came as a bit of a surprise.
With Party 2 members making up 98% of the Voters at the end of the simulation it’s unclear how Party 1 won at all!
However, this is a good reminder that Voters in our simulation are not bound to voting within their party. This may also be reminiscent of the Condorcet paradox, which essentially states that: “Collective preferences may be cyclic, even if individual voter preferences are not.”
We’re interested in looking more into the ways our simulation may demonstrate this paradox, and possibly if we can add a visualization option to recognize its occurrence in voting periods with unexpected results.
With Party 2 members making up 98% of the Voters at the end of the simulation it’s unclear how Party 1 won at all!
However, this is a good reminder that Voters in our simulation are not bound to voting within their party. This may also be reminiscent of the Condorcet paradox, which essentially states that: “Collective preferences may be cyclic, even if individual voter preferences are not.”
We’re interested in looking more into the ways our simulation may demonstrate this paradox, and possibly if we can add a visualization option to recognize its occurrence in voting periods with unexpected results.
If we were surprised seeing the first Number Line, imagine our shock at seeing this one!
Despite the fact that >93% of Voters were aligned with Party 2 throughout the run, it seems impossible that Party 1 would win the majority of races. However, there are a few interesting things to notice about this graph.
First, that there were blocks of wins. Both parties went on long win streaks and didn’t experience many quick tradeoffs throughout the run. In fact, the only quick power switch occurred at t=29 when a Party 1 candidate won but switched to Party 2 the following year!
We infer, this candidate likely already had a lot in common with Party 2 when they were elected initially under Party 1’s ticket, so you could say the Party 2 win streak didn’t completely break there.
At the very least, there was no major ideological shift from the voters to warrant that particular Party 1 win. Of the win streaks, Party 1 had a healthy variety of different candidates every turn, and didn’t have many re-elected officials.
Party 2, on the other hand, dedicated the majority of its wins to repeat winners. This could mean that Party 1 candidates tend to stand more in the center on average, but don’t have the ideological territory to stand in the ideal center spot (without switching to Party 2, as Politician #14 did).
This would make sense for why Party 1’s winners are scattered, but Party 2’s candidates tend to be repeats. We made a purely thought-based diagram to make this explanation make a bit more sense, but keep in mind that it is entirely hypothetical and does not correspond to actual data.
Despite the fact that >93% of Voters were aligned with Party 2 throughout the run, it seems impossible that Party 1 would win the majority of races. However, there are a few interesting things to notice about this graph.
First, that there were blocks of wins. Both parties went on long win streaks and didn’t experience many quick tradeoffs throughout the run. In fact, the only quick power switch occurred at t=29 when a Party 1 candidate won but switched to Party 2 the following year!
We infer, this candidate likely already had a lot in common with Party 2 when they were elected initially under Party 1’s ticket, so you could say the Party 2 win streak didn’t completely break there.
At the very least, there was no major ideological shift from the voters to warrant that particular Party 1 win. Of the win streaks, Party 1 had a healthy variety of different candidates every turn, and didn’t have many re-elected officials.
Party 2, on the other hand, dedicated the majority of its wins to repeat winners. This could mean that Party 1 candidates tend to stand more in the center on average, but don’t have the ideological territory to stand in the ideal center spot (without switching to Party 2, as Politician #14 did).
This would make sense for why Party 1’s winners are scattered, but Party 2’s candidates tend to be repeats. We made a purely thought-based diagram to make this explanation make a bit more sense, but keep in mind that it is entirely hypothetical and does not correspond to actual data.
In this diagram, assume the orange as Party 2’s ideological territory, and the black as Party 1’s ideological territory.
The blue circle contains the ideological location of all Voters, and they are distributed normally throughout the circle so that the amount of Voters you can expect to be in any body inside the main circle is linearly related to the area of the body.
Politicians will always win the largest amount of voters by standing within the center point. Politicians can move freely throughout the territory and can switch party lines, but by doing so they change parties.
In the actual simulation, parties can also change ideology, but for simplicity of explanation, imagine that they don’t in this diagram. In general, Politicians will move throughout each simulation but probably not by much during their lifetime, which in the simulation amounts to 5 turns at most.
Remember that the actual location of the center point of each Party in this simulation has five dimensions, since there are five beliefs by default, so it’s impossible to accurately plot how actual Party territory is shaped with our default settings.
This is merely a visualization to explain the points made prior. Here, we can see that any Politician randomly generated within Party 1’s territory is on average, closer to the center of the circle than the average randomly generated Party 2 politician.
However, Party 1 does not have territory on the center point, so it would be impossible for Party 1 Politicians to compete with an aptly placed Party 2 Politician without crossing party lines.
This makes sense for why winners for Party 1 would often be repeat winners, and why winners for Party 2 often were not. Certain well-placed members of Party 1 were unbeatable by Party 2, while during periods of bad luck for Party 1, Party 2 was just more likely to win on average.
This has nothing to do with the fact that repeat wins were common in the simulation though, and that probably has more to do with Party changes over time. These are all assumptions made to explain the reasoning behind speculations made earlier, and not based on data.
The blue circle contains the ideological location of all Voters, and they are distributed normally throughout the circle so that the amount of Voters you can expect to be in any body inside the main circle is linearly related to the area of the body.
Politicians will always win the largest amount of voters by standing within the center point. Politicians can move freely throughout the territory and can switch party lines, but by doing so they change parties.
In the actual simulation, parties can also change ideology, but for simplicity of explanation, imagine that they don’t in this diagram. In general, Politicians will move throughout each simulation but probably not by much during their lifetime, which in the simulation amounts to 5 turns at most.
Remember that the actual location of the center point of each Party in this simulation has five dimensions, since there are five beliefs by default, so it’s impossible to accurately plot how actual Party territory is shaped with our default settings.
This is merely a visualization to explain the points made prior. Here, we can see that any Politician randomly generated within Party 1’s territory is on average, closer to the center of the circle than the average randomly generated Party 2 politician.
However, Party 1 does not have territory on the center point, so it would be impossible for Party 1 Politicians to compete with an aptly placed Party 2 Politician without crossing party lines.
This makes sense for why winners for Party 1 would often be repeat winners, and why winners for Party 2 often were not. Certain well-placed members of Party 1 were unbeatable by Party 2, while during periods of bad luck for Party 1, Party 2 was just more likely to win on average.
This has nothing to do with the fact that repeat wins were common in the simulation though, and that probably has more to do with Party changes over time. These are all assumptions made to explain the reasoning behind speculations made earlier, and not based on data.
Possible Improvements, Conclusion, and Future Directions
Possible Improvements, Conclusion, and Future Directions
This essay would not be complete without mentioning the flaws and shortcomings of our simulation.
Three months of doing this on our (limited) free time was not enough to make it perfectly bug free with every feature we wanted to add and every function tweaked to perfection. Certain settings or buttons occasionally corrupt the starting variables, we don’t have as many visualization tools as we think we need, and some of the relational functions create unexpected phenomena in the system (like the previously mentioned issue with Party balancing).
But despite challenges, this project has turned out to be nothing short of fascinating, and we’re so excited to be able to step back from this a bit and play with the tool we made before some of us who’ve decided we’d like to continue the project get back to making it better.
Some of the changes we plan to implement include adding more clarity to graphs, adding an option for seeing vote distribution across voting periods, an option for two-round voting system or something similar, ways to see the Condorcet paradox in practice in our simulation (if we find that to be relevant to our specific simulation), better Party dynamics, and much more.
If there’s a lot of interest in our simulation, we’ll also add visualizations or options that the community is interested in.
Three months of doing this on our (limited) free time was not enough to make it perfectly bug free with every feature we wanted to add and every function tweaked to perfection. Certain settings or buttons occasionally corrupt the starting variables, we don’t have as many visualization tools as we think we need, and some of the relational functions create unexpected phenomena in the system (like the previously mentioned issue with Party balancing).
But despite challenges, this project has turned out to be nothing short of fascinating, and we’re so excited to be able to step back from this a bit and play with the tool we made before some of us who’ve decided we’d like to continue the project get back to making it better.
Some of the changes we plan to implement include adding more clarity to graphs, adding an option for seeing vote distribution across voting periods, an option for two-round voting system or something similar, ways to see the Condorcet paradox in practice in our simulation (if we find that to be relevant to our specific simulation), better Party dynamics, and much more.
If there’s a lot of interest in our simulation, we’ll also add visualizations or options that the community is interested in.