Fluxes and Energetics of Photosynthesis and Photorespiration
Fluxes and Energetics of Photosynthesis and Photorespiration

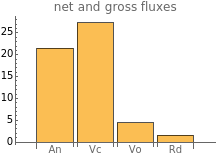


This Demonstration shows the fluxes and partitioning of energy associated with primary carbon metabolism. The upper-left graph shows the flux of leaf-level net carbon assimilation (; ), and the three components that contribute to : the fluxes of photosynthetic carbon uptake (; ), photorespiratory carbon loss (; ) and mitochondrial carbon loss (; ). The three pie charts show the energy partitioned between photosynthesis () and photorespiration () specifically for the partitioning of electrons (top right), of (bottom left) and of (bottom right).
An
µmol
-2
m
-1
s
An
Vc
µmol
-2
m
-1
s
Vo
µmol
-2
m
-1
s
Rd
µmol
-2
m
-1
s
Vc
Vo
NADPH
ATP
Details
Details
This Demonstration uses the leaf model of photosynthesis[1] coupled with temperature corrections[2–6] to model the net and gross carbon fluxes associated with primary carbon metabolism and the partitioning of energy into photosynthesis and photorespiration. This Demonstration was created as a supplement to a review article on the costs of photorespiration[7].
The leaf model is parameterized with a maximum velocity of the enzyme for carboxylation =100, a maximum rate of electron transport =180, a rate of triose-phosphate utilization , and a rate of mitochondrial respiration , as described in[2, 3].
RuBisCo
V
c,max
J
max
TPU=10.5
Rd=1.5
References
References
[1] G. D. Farquhar, S. von Caemmerer, and J. A. Berry, "A Biochemical Model of Photosynthetic Assimilation in Leaves of Species," Planta, 149(1), 1980 pp. 78–90. doi:10.1007/BF00386231.
CO
2
C
3
[2] C. J. Bernacchi, C. Pimentel, and S. P. Long, "In Vivo Temperature Response Functions of Parameters Required to Model RuBP-Limited Photosynthesis," Plant, Cell & Environment, 26(9), 2003 pp. 1419–1430. doi:10.1046/j.0016-8025.2003.01050.x.
[3] C. J. Bernacchi, E. L. Singsaas, C. Pimentel, A. R. Portis Jr, and S. P. Long, "Improved Temperature Response Functions for Models of Rubisco-Limited Photosynthesis," Plant, Cell & Environment, 24(2), 2001 pp. 253–259. doi:10.1111/j.1365-3040.2001.00668.x.
[4] C. J. Bernacchi, C. J. Bagley, S. P. Serbin, U. M. Ruiz-Vera, D. M. Rosenthal, and A. VanLoocke, "Modeling Photosynthesis from the Chloroplast to the Ecosystem," Plant, Cell & Environment, 36(9), 2013 pp. 1641–1657. doi:10.1111/pce.12118.
C
3
[5] P. C. Harley, R. B. Thomas, J. F. Reynolds, and B. R. Strain, "Modelling Photosynthesis of Cotton Grown in Elevated ," Plant, Cell & Environment, 15(3), 1992 pp. 271–282. doi:10.1111/j.1365-3040.1992.tb00974.x.
CO
2
[6] T. June, J. R. Evans, and G. D. Farquhar, "A Simple New Equation for the Reversible Temperature Dependence of Photosynthetic Electron Transport: A Study on Soybean Leaf," Functional Plant Biology 31(3), 2004 pp. 275–283. doi:10.1071/FP03250.
[7] B. J. Walker, A. VanLoocke, C. J. Bernacchi, and D. R. Ort, "The Costs of Photorespiration," Annual Review of Plant Biology, forthcoming.
External Links
External Links
Permanent Citation
Permanent Citation
Carl J. Bernacchi, Andy VanLoocke, Berkley Walker, Donald Ort
"Fluxes and Energetics of Photosynthesis and Photorespiration"
http://demonstrations.wolfram.com/FluxesAndEnergeticsOfPhotosynthesisAndPhotorespiration/
Wolfram Demonstrations Project
Published: November 25, 2015