Last week I started my specialization in infectious disease modeling at Imperial College London. This educational program helps me to better understand mathematical models in epidemiology. In the following notebook, I solved the activities in vaccination provided by this program
In this exercise, we are going back to the simple SIR model, without births or deaths, to look at the effect of vaccination. The aim of this activity is to represent vaccination in a very simple way - we are assuming it already happened before we run our model! By changing the initial conditions, we can prepare the population so that it has received a certain coverage of vaccination.
We are starting with the transmission and recovery parametersand . To incorporate immunity from vaccination in the model, we assume that a proportion of the total population starts in the recovered compartment, representing the vaccine coverage and assuming the vaccine is perfectly effective. Again, we assume the epidemic starts with a single infected case introduced into the population.
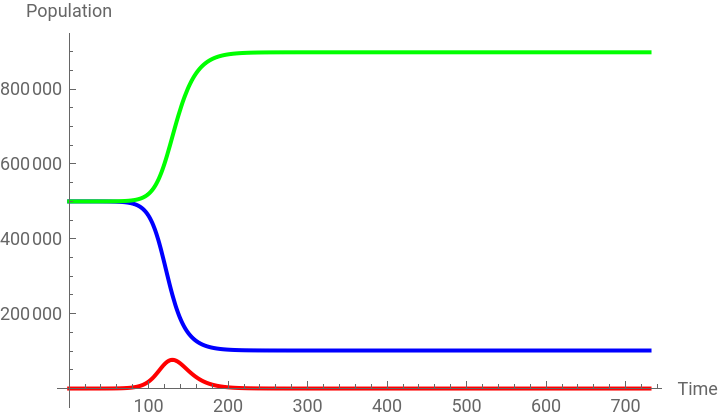
We are going to model this scenario for a duration of 2 years, assuming that the vaccine coverage is 50%, and plot the prevalence in each compartment over time. Could you confirm that you observe an epidemic peaking at around 125 days after introduction of the infectious person in the population?
We are starting with the transmission and recovery parameters
β0.4day
-1
s
γ0.1day
-1
s
p
We are going to model this scenario for a duration of 2 years, assuming that the vaccine coverage is 50%, and plot the prevalence in each compartment over time. Could you confirm that you observe an epidemic peaking at around 125 days after introduction of the infectious person in the population?
In[]:=
Clear["Global`*"]
Parameters
(*Recoveryrate*)γ=0.1;(*infectionrate*)β=0.4;(*FoI*)λ[t_]:=β*i[t]/n(*TotalPopulationSize*)n=10^6;
2 years in days
tMax1=2*365;
Vaccine coverage
In[]:=
p=0.5;
Define the system of differential equations
eqns={s'[t]==-λ[t]*s[t],i'[t]==λ[t]*s[t]-γ*i[t],r'[t]==γ*i[t],s[0]==(1-p)*n,i[0]==1,r[0]==p*(n-1)};
Solve the system
sol=NDSolve[eqns,{s,i,r},{t,0,tMax1}];
Plot the solutions
Plot[Evaluate[{s[t],i[t],r[t]}/.sol],{t,0,tMax1},PlotLegends->{"Susceptible","Infected","Recovered"},AxesLabel->{"Time","Population"},AxesLabel->{"Time","Population"},PlotStyle->{Blue,Red,Green}]
Out[]=


In[]:=
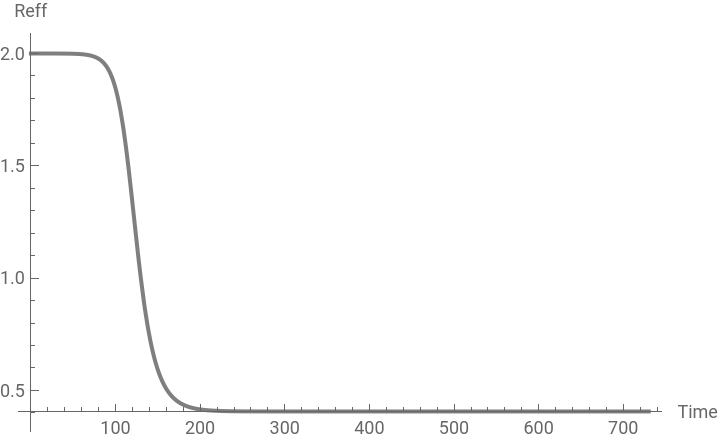
Reff[t_]=(β/γ)*(s[t]/n);
In[]:=
Plot[Reff[t]/.sol,{t,0,tMax1},PlotStyle->Gray,AxesLabel->{"Time","Reff"}]
Out[]=
Increasing the vaccine coverage to 75%
Increasing the vaccine coverage to 75%
In[]:=
Clear["Global`*"]
Parameters
(*Recoveryrate*)γ=0.1;(*infectionrate*)β=0.4;(*FoI*)λ[t_]:=β*i[t]/n(*TotalPopulationSize*)n=10^6;
2 years in days
tMax1=2*365;
Vaccine coverage
p=0.75;
Define the system of differential equations
eqns={s'[t]==-λ[t]*s[t],i'[t]==λ[t]*s[t]-γ*i[t],r'[t]==γ*i[t],s[0]==(1-p)*n,i[0]==1,r[0]==p*(n-1)};
In[]:=
sol=NDSolve[eqns,{s,i,r},{t,0,tMax1}];
Plot the solutions
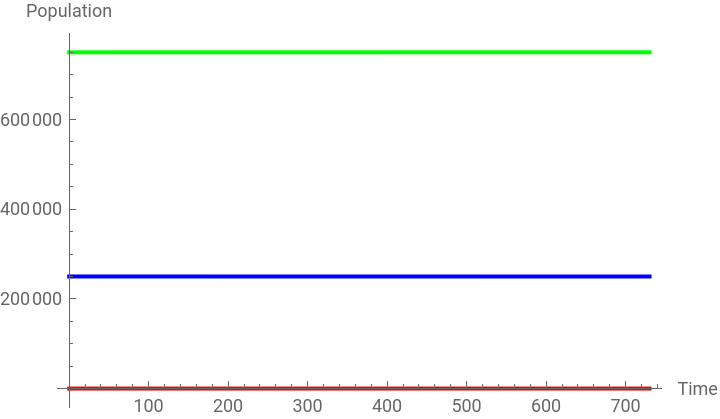
Plot[Evaluate[{s[t],i[t],r[t]}/.sol],{t,0,tMax1},PlotLegends->{"Susceptible","Infected","Recovered"},AxesLabel->{"Time","Population"},AxesLabel->{"Time","Population"},PlotStyle->{Blue,Red,Green}]
Out[]=
In[]:=
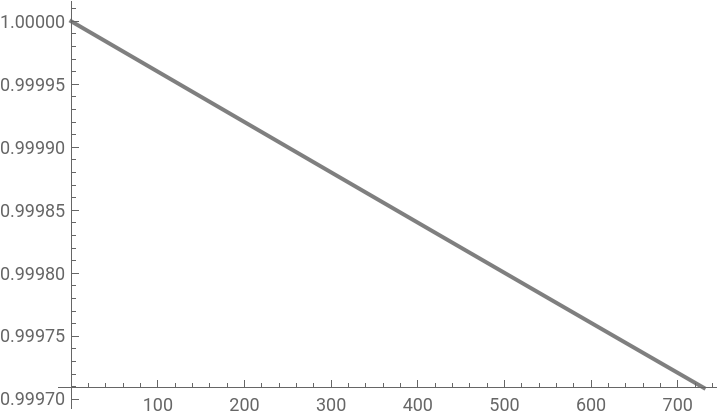
Reff[t_]=(β/γ)*(s[t]/n);
In[]:=
Plot[Reff[t]/.sol,{t,0,tMax1},PlotStyle->Gray]
Out[]=
Does everyone in the population need to be vaccinated in order to prevent an epidemic?What do you observe if you model the infection dynamics with different values for p?
Does everyone in the population need to be vaccinated in order to prevent an epidemic?What do you observe if you model the infection dynamics with different values for ?
p
No, not everyone in the population needs to be vaccinated in order to prevent an epidemic . In this scenario, if equals 0.75 or higher, no epidemic occurs - 75 % is the critical vaccination/herd immunity threshold . Remember,, herd immunity describes the phenomenon in which there is sufficient immunity in a population to interrupt transmission . Because of this, not everyone needs to be vaccinated to prevent an outbreak .
p
What proportion of the population needs to be vaccinated in order to prevent an epidemic if β0.4 and γ0.2 day-1s? What if β0.6 and γ0.1day-1s?
What proportion of the population needs to be vaccinated in order to prevent an epidemic if and ? What if and ?
β0.4
γ0.2
day
-1
s
β0.6
γ0.1day
-1
s
In the context of the SIR model, the critical proportion of the population that needs to be vaccinated in order to prevent an epidemic is often referred to as the "herd immunity threshold" or "critical vaccination coverage."
◼
Scenario 1 : and
β0.4
γ0.2
day
-1
s
In[]:=
Clear["Global`*"]
In[]:=
(*Recoveryrate*)γ=0.2;(*infectionrate*)β=0.4;(*FoI*)λ[t_]:=β*i[t]/n(*TotalPopulationSize*)n=10^6;
2 years in days
tMax1=2*365;
Vaccine coverage
p=0.5;
Define the system of differential equations
eqns={s'[t]==-λ[t]*s[t],i'[t]==λ[t]*s[t]-γ*i[t],r'[t]==γ*i[t],s[0]==(1-p)*n,i[0]==1,r[0]==p*(n-1)};
Plot the solutions
The required vaccination coverage is around 50% .
2 years in days
Vaccine coverage
Define the system of differential equations
Plot the solutions
The required vaccination coverage is around 83 % .
CITE THIS NOTEBOOK
CITE THIS NOTEBOOK
A simple example for vaccination effect in SIR model
by Athanasios Paraskevopoulos
Wolfram Community, STAFF PICKS, August 23, 2023
https://community.wolfram.com/groups/-/m/t/2996340
by Athanasios Paraskevopoulos
Wolfram Community, STAFF PICKS, August 23, 2023
https://community.wolfram.com/groups/-/m/t/2996340