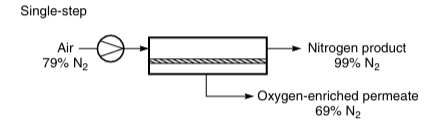
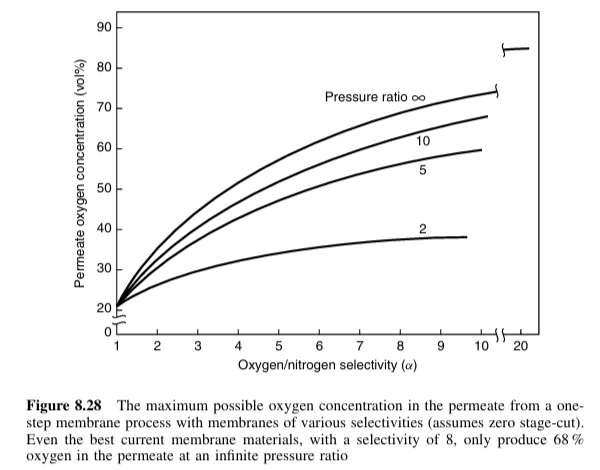
Nitrogen production process generates an oxygen-enriched permeate stream as by-product.The maximum possible oxygen concentration in the permeate from a one step membrane process is given in Figure 8.28 of Ref. 1. It is foundthat with pressure ratio=10 and selectivity=8, the oxygen concentration in the permeate stream does not exceed 68 % mole.We reproduce Fig. 8.28 of Ref. 1 using a cross-flow gas permeation module and the methodology described in detail in Ref. 2.References:[1] Richard W. Baker, Membrane Technology And Applications, Second Edition, NY: John Wiley & Sons, 2004. [2] H . Binous, U . Zahid and A . Bellagi, Modeling for Multi - component Gas Permeation with Orthogonal Collocation and Arc - Length Continuation, Chemistry Africa (2024) . https://doi.org/10.1007/s42250-024-01167-y
In[]:=
eq1i=/()qA(xA[Np+1]-/)/(qB(xB[Np+1]-/));eq2i=+1;xAin=0.79;qA=1;qB=alpha;=1.0;=gamma;Np=20;d[0,0]=(2Np^2+1)/6//N;d[Np,Np]=-(2Np^2+1)/6//N;yc[i_]:=Cos[iPi/Np]//N;d[i_,i_]:=-yc[i]/(2(1-yc[i]^2))//N;d[j_,k_]:=If[j≠k&&k≠0&&k≠Np&&j≠0&&j≠Np,(-1)^(j+k)/(yc[j]-yc[k])]//N;d[Np,0]=-1/2(-1)^Np;d[0,Np]=1/2(-1)^Np;d[j_,0]:=If[j≠Np&&j≠0,-1/2(-1)^j/(1-yc[j])];d[j_,Np]:=If[j≠Np&&j≠0,1/2(-1)^(j+Np)/(1+yc[j])];d[0,j_]:=If[j≠Np&&j≠0,2(-1)^j/(1-yc[j])];d[Np,j_]:=If[j≠Np&&j≠0,-2(-1)^(j+Np)/(1+yc[j])];Add=Table[d[i,j]//N,{i,0,Np},{j,0,Np}];xAp[i_]:=2/stAdd[[i,j]]xA[j];yAp[i_]:=2/stAdd[[i,j]]yA[j]qp[i_]:=2/stAdd[[i,j]]q[j];eq1[i_]:=-yA[i]qp[i]qA(xA[i]-/yA[i]);eq2[i_]:=-(1-yA[i])qp[i]qB((1-xA[i])-/(1-yA[i]));eq3[i_]:=yA[i]qp[i]q[i]xAp[i]+qp[i]xA[i];yB[i_]:=1-yA[i]xB[i_]:=1-xA[i]xA[Np+1]=xAin;yA[Np+1]=;q[Np+1]=;q[1]=(1-theta);xA[1]=0.9;unknown=Join[Flatten[Join[Table[{{xA[i],0.7}},{i,2,Np}],Table[{{yA[i],0.5}},{i,1,Np}],Table[{{q[i],0.99}},{i,2,Np}]],1],{{theta,0.06},{,0.97},{,0.3},{st,0.1}}];sys[gamma_,alpha_]:=Flatten@Join[Table[{eq1[i],eq2[i],eq3[i]},{i,2,Np}],{eq1i,eq2i,eq1[1],eq2[1],eq3[Np+1]}];sol[g_,a_]:=FindRoot[sys[g,a]/.alpha->a/.gamma->g,unknown,MaxIterations10000];solA=First@NSolve[thetayAP+(1-theta)xA[1]xAin,yAP];
y
PAi
y
PBi
p
l
p
h
y
PAi
p
l
p
h
y
PBi
y
PAi
y
PBi
q
f
p
h
p
l
Np+1
∑
j=1
Np+1
∑
j=1
Np+1
∑
j=1
p
l
p
h
p
l
p
h
y
PAi
q
f
q
f
q
f
y
PAi
y
PBi
In[]:=
S=sol[10,2]
Out[]=
{xA[2]0.8991,xA[3]0.896449,xA[4]0.892182,xA[5]0.886505,xA[6]0.879674,xA[7]0.871965,xA[8]0.863661,xA[9]0.855031,xA[10]0.846324,xA[11]0.837762,xA[12]0.829538,xA[13]0.821816,xA[14]0.814732,xA[15]0.808399,xA[16]0.802907,xA[17]0.798326,xA[18]0.794712,xA[19]0.792103,xA[20]0.790527,yA[1]0.830952,yA[2]0.82954,yA[3]0.825391,yA[4]0.818746,yA[5]0.80997,yA[6]0.799502,yA[7]0.787814,yA[8]0.775365,yA[9]0.762584,yA[10]0.749848,yA[11]0.737476,yA[12]0.725733,yA[13]0.71483,yA[14]0.704931,yA[15]0.696165,yA[16]0.688625,yA[17]0.682381,yA[18]0.677482,yA[19]0.673962,yA[20]0.671841,q[2]0.313493,q[3]0.32554,q[4]0.345349,q[5]0.372509,q[6]0.406448,q[7]0.446432,q[8]0.49157,q[9]0.540827,q[10]0.593047,q[11]0.64697,q[12]0.701269,q[13]0.754579,q[14]0.805538,q[15]0.852826,q[16]0.895201,q[17]0.931541,q[18]0.960874,q[19]0.982412,q[20]0.995573,theta0.69055,0.671133,0.328867,st0.667803}
y
PAi
y
PBi
In[]:=
(*concentrationofoxygeninthepemeatestreamforcross-flowpattern,pressureratio=10andmembraneselectivity=2*)
In[]:=
avg=1-yAP/.solA/.S
Out[]=
0.259293
(*oxygenconcentrationinthegaspermeator(premeateside)versusposition*)
In[]:=
tbl=Table[{(yc[i-1]+1)/2,yB[i]/.S},{i,21,1,-1}]
Out[]=
{{0.,0.328867},{0.00615583,0.328159},{0.0244717,0.326038},{0.0544967,0.322518},{0.0954915,0.317619},{0.146447,0.311375},{0.206107,0.303835},{0.273005,0.295069},{0.345492,0.28517},{0.421783,0.274267},{0.5,0.262524},{0.578217,0.250152},{0.654508,0.237416},{0.726995,0.224635},{0.793893,0.212186},{0.853553,0.200498},{0.904508,0.19003},{0.945503,0.181254},{0.975528,0.174609},{0.993844,0.17046},{1.,0.169048}}
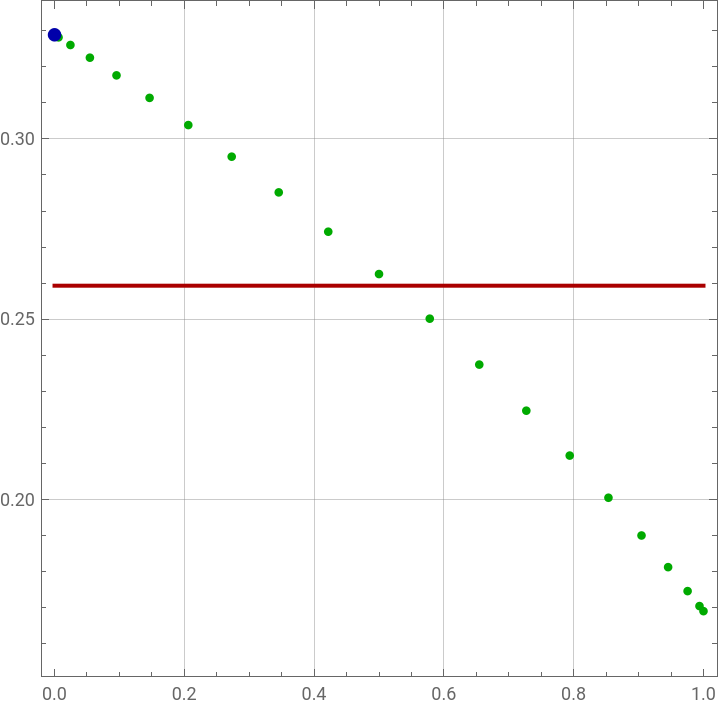
(*premeateexitconcentrationisindicatedbytheredlinewhiletheoxygenconcentrationattheinletofthepermeateside,labeledby,isdepictedbythebluedot.Notethatisthepermeateoxygenmolefractionifoneassumesazerostage-cut.*)(*Clearlyistheupperlimitorthehighestachievableoxygenmolefractioninthepermeateside*)
y
PAi
y
PAi
y
PAi
In[]:=
ListPlot[tbl,Frame->True,GridLines->Automatic,AspectRatio->1,PlotStyle->Darker@Green,Epilog->{PointSize[0.02],Darker@Blue,Point[{0,/.S}],Darker@Red,Thick,Line[{{0,avg},{1,avg}}]}]
y
PBi
Out[]=
(*letattempttoreproduceFig8.28todosowecomputeandplotforvariousvaluesofthepressureratioandforselectivitiesrangingfrom1to10*)
y
PAi