A genetic sequence can be mapped into some numeric spaces for classifying and clustering of corresponding species. A common technique is Chaos Game Representation (CGR) where a 2D vector is assigned to each letter of a genetic sequence based off some iterative chaotic methods. In this computational essay, I use available 2019-nCoV genome and apply some common CGR methods. Then, I study how one can do some clusterings using ML techniques.
Collecting data
Collecting data
I collect the complete genome data of coronavirus from the Wolfram Data Repository. For each sequence, the trailing sequences of adenines are dropped, as suggested here, in order to avoid arbitrary matches on varying poly(A) RNA tail lengths.
Drop the trailing sequence of A from a sequence:
In[]:=
dropTrailingA[seq_]:=StringReplace[seq,StartOfString~~Shortest[a__]~~("A"..)~~EndOfStringa];
Get the dataset from WDR, select those with complete genome:
In[]:=
ds0=ResourceData["Genetic Sequences for Novel Coronavirus 2019-nCoV from Wuhan, China"][Select[StringContainsQ[#GenBankTitle,"complete genome"]&]];
Select only the Accession and Sequence columns, then map dropTrailingA onto the Sequence column:
In[]:=
ds=ds0[All,{"Accession","Sequence"}][All,{"Sequence"dropTrailingA}];
Take only the string characters up to the shortest string length:
In[]:=
dsTrimmed=Module[{min=ds[Min@*StringLength,"Sequence"],trim},trim[st_]:=StringTake[st,min];ds[All,{"Sequence"trim}]];
Generate an association with accessions as keys and sequences as values:
In[]:=
tagSeq=<|Rule@@@Normal[Values[dsTrimmed]]|>;
Replacement rule to change U by T and keep only A, C, G and T:
In[]:=
srules={"U""T",Except[Characters["ACGT"]]""};
Apply the replacement rule on the sequences:
In[]:=
data=StringReplace[srules]/@tagSeq;
CGR of gene structure.
CGR of gene structure.
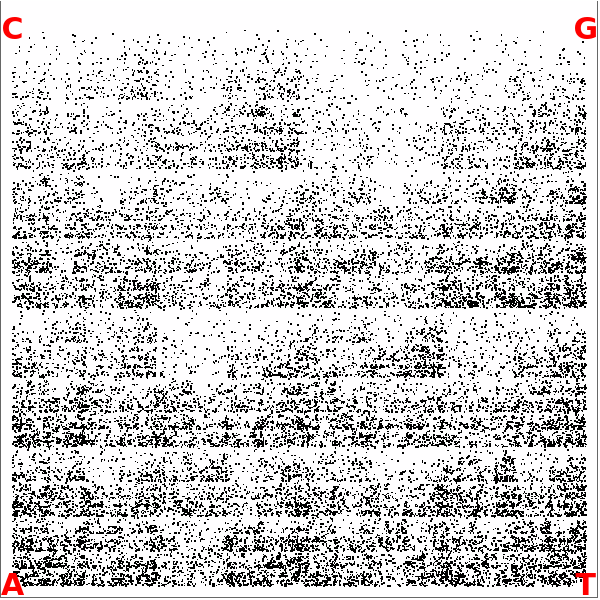
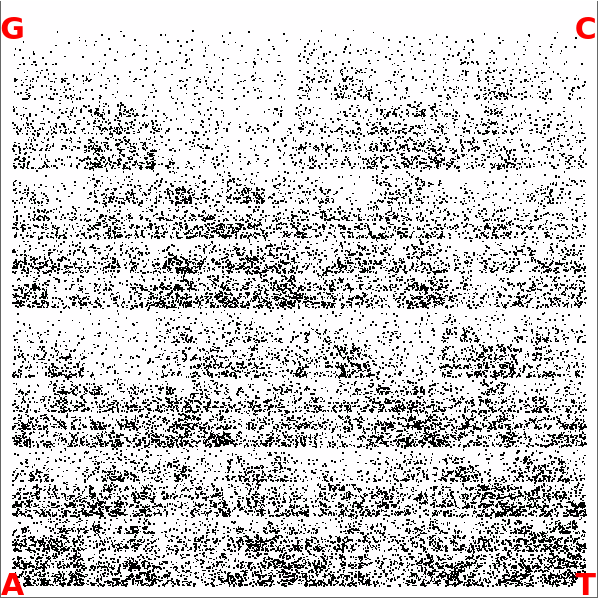
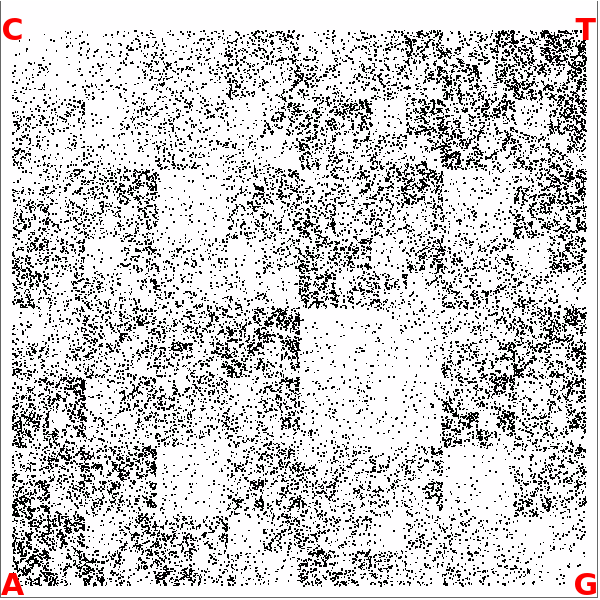
Chaos Game Representation (CGR) of gene structure is one of the most popular methods among many that have been proposed to visualizing genetic data. CGR images show rich fractal patterns that can be used to clustering (classifying) the various species. Using some CGR algorithm, a 2D point is assigned to each character in the genetic sequence using a iterative method.
Given a string and a configuration, generate the corresponding CGR space (assign a point to each character in the sequence):
In[]:=
chaosGen[st_String,conf_]:=Module[{dt=Characters[st]/.conf},FoldList[#1-.5(#1-#2)&,{0.5,0.5},dt]];
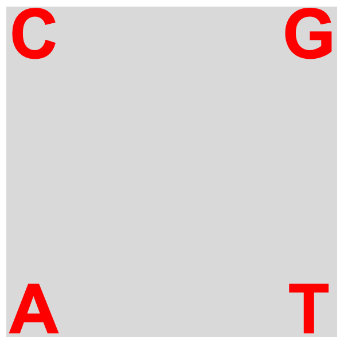
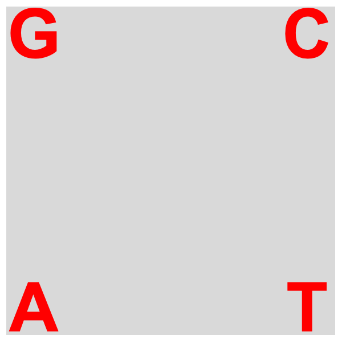
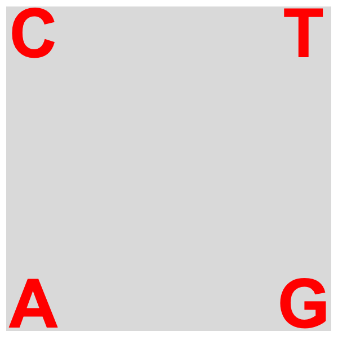
I consider three configurations to generate CGR space. The CGR-RY is the original one suggested by Jeffery, where binary CGR vertices are “A”{0,0},”G”{1,1},”C”{0,1} and ”T”{1,0}. There are other suggestions in the literature, that take into the account the chemical structures of the four nucleic acid bases. The one called CGR-MK considers amino group M = {A, C} as off-diagonal elements and keto group K = {G, T} as diagonal ones, while CGR-WS classifies them into weak H-bonds W = {A, T} and strong H-bonds S = {G, C}.
Define binary CGR-RY vertices:
In[]:=
confRY={"A"{0,0},"G"{1,1},"C"{0,1},"T"{1,0}};
Define binary CGR-MK vertices:
In[]:=
confMK={"A"{0,0},"C"{1,1},"G"{0,1},"T"{1,0}};
Define binary CGR-WS vertices:
In[]:=
confWS={"A"{0,0},"T"{1,1},"C"{0,1},"G"{1,0}};
Define corresponding labels for the CGR vertices configuration:
In[]:=
labels[conf_]:=Which[conf===confRY,"CGR-RY",conf===confMK,"CGR-MK",conf===confWS,"CGR-WS"];
Given a rectangle, put the amino acid labels at each corner, which depends on the CGR configuration:
Row@Table[Labeled[Graphics[{LightGray,Rectangle[{-.1,-.1},{1.1,1.1}]},AxesNone,ImageSize100,Epilog(Text[Style[#〚1〛,Bold,Red,FontSize20],#〚2〛]&/@config)],labels[config]],{config,{confRY,confMK,confWS}}]
Out[]=
CGR-RY |
CGR-MK |
CGR-WS |
Generate corresponding CGR space for the corona viruses from WDR:
In[]:=
Manipulate[Row[Table[Labeled[Rasterize[ListPlot[{chaosGen[data[Accession],config]},AspectRatio1,FrameTrue,FrameTicksNone,AxesFalse,PlotStyleBlack,ImageSize400,Epilog(Text[Style[#〚1〛,Bold,Red,FontSize20],#〚2〛]&/@config)],RasterSize600],labels[config]],{config,{confRY,confMK,confWS}}]],{Accession,Keys[data]},SaveDefinitionsTrue]
Out[]=

Wolfram Function Repository: FCGRImage
Wolfram Function Repository: FCGRImage
One can generate an image out of CGR numeric data. The FCGRImage function from the Wolfram Function Repository, produces a Frequency Chaos Game Representation image from a string of nucleotides. It uses the original binary CGR vertices proposed by Jeffery.
Generate the FCGR image from the genetic sequences in data, at the resolution 2^8:
In[]:=
Manipulate[Labeled[ResourceFunction["FCGRImage"][data[Accession],8,ImageSize400],"Frequency Chaos Game Representation Image at the resolution "],{Accession,Keys[data]},SaveDefinitionsTrue]
8
2
Out[]=
Clustering and classification
Clustering and classification
We will generate the CGR spaces using three different vertices configurations. Then we will study clustering using some ML techniques.
Generate the CGR space from the data using a configuration:
In[]:=
pntsCGR[conf_]:=chaosGen[#,conf]&/@data;
Y-axis labeling using viruses accessions:
X-axis labeling using viruses accessions:
CGR-RY space
CGR-RY space
Generate the CGR-RY space:
Construct a feature extractor from a numerical dataset using the “NumericVector” extractor method:
Use the feature extractor on the training set:
Generate an operator form of FeatureDistance using fe:
Compute the distance matrix using fd as a distance function::
Plot the distance matrix as an array of colors with proper labels:
Cluster the data in 4 clusters by using the Agglomerate method and fd as the distance function:
Define a function that produce 2D or 3D representation of clusters by projecting features into 2D or 3D using a method:
Generates a 3D scatter plot of points in each cluster using “TSNE” to reduce the dimension:
Generates a 2D scatter plot of points in each cluster using “TSNE” to reduce the dimension:
Constructs a dendrogram from the hierarchical clustering of CGR space using the distance function fd:
CGR-MK space
CGR-MK space
Generate the CGR-RY space:
Construct a feature extractor from a numerical dataset using the “NumericVector” extractor method:
Use the feature extractor on the training set:
Generate an operator form of FeatureDistance using fe:
Compute the distance matrix using fd as a distance function::
Plot the distance matrix as an array of colors with proper labels:
Cluster the data in 4 clusters by using the Agglomerate method and fd as the distance function:
Define a function that produce 2D or 3D representation of clusters by projecting features into 2D or 3D using a method:
Generates a 3D scatter plot of points in each cluster using “TSNE” to reduce the dimension:
Generates a 2D scatter plot of points in each cluster using “TSNE” to reduce the dimension:
Constructs a dendrogram from the hierarchical clustering of CGR space using the distance function fd:
CGR-WS space
CGR-WS space
Generate the CGR-RY space:
Construct a feature extractor from a numerical dataset using the “NumericVector” extractor method:
Use the feature extractor on the training set:
Generate an operator form of FeatureDistance using fe:
Compute the distance matrix using fd as a distance function::
Plot the distance matrix as an array of colors with proper labels:
Cluster the data in 4 clusters by using the Agglomerate method and fd as the distance function:
Define a function that produce 2D or 3D representation of clusters by projecting features into 2D or 3D using a method:
Generates a 3D scatter plot of points in each cluster using “TSNE” to reduce the dimension:
Generates a 2D scatter plot of points in each cluster using “TSNE” to reduce the dimension:
Constructs a dendrogram from the hierarchical clustering of CGR space using the distance function fd:
Comparing dendrograms
Comparing dendrograms
Final comments
Final comments
What is the interpretation of the above clusterings? My honest answer would be: I don’t know, yet. Here, I only discussed some ML techniques for clustering of CGR numeric data, generated for recent 2019 novel coronavirus. Stealing some concluding words from Dr. Daniel Lichtblau, “I hope these are applicable to work other people are doing. I also hope others will consider contributing their own work to this forum”. Last but not least, one can also use the Hierarchical Clustering Package, to do further analysis of the genetic sequences.
Relevant community posts
Relevant community posts