Sampling Theorem
Sampling Theorem


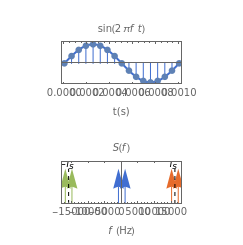
The top figure shows a sine wave of frequency and its samples. The bottom figure shows the Fourier spectrum of the sampled signal. It consists of two spectral lines at , repeated periodically at integer multiples of the sampling rate .
f
S(f)
±f
f
s
According to the sampling theorem, for , the samples uniquely represent the sine wave of frequency . For , aliasing occurs, because the replicated spectra begin to overlap. In the range , a spectral line appears at the frequency . In the upper figure the sine wave with the corresponding frequency and color appears.
f≤/2
f
s
f
f>/2
f
s
0≤f≤/2
f
s
|f-|
f
s
Note that for =8kHz and , additional lines at and appear in the spectrum.
f
s
f>6kHz
-f+2
f
s
f-2
f
s