In American politics, the two main political parties are the Democratic and Republican Party. As the 2024 presidential election is approaching at the time of writing this essay, it is clearer than ever the differences in the ideologies between the Democratic and Republican parties. The Democratic Party represents the liberals while the Republican Party embraces conservatism. However, the ideologies of the two political parties have changed significantly from over 120 years ago and this project explores how machine learning and natural language processing could analyze the changes. By utilizing vector embedding on the party platforms of the political parties and then using dimension reduction and classification methods, it was clear that although the two political parties’ ideologies have shifted apart and focused on different topics in different timeframes, some similarities continued to exist. This project also shows the extensive influence of machine learning on industries and academic fields that are completely different from computer science, such as political science, as it is in this case.
Introduction
Introduction
Politics have been an essential part of society since the very beginning, shaping the structure of our government and policies, which in turn affect our lives. The importance of politics has also led to various political thoughts, such as certain beliefs, policies, and ideas. Throughout the world, people and politicians with similar political thoughts and ideologies have come together to form political entities known as political parties.
In the United States, the two major political parties are the Democratic Party and the Republican Party. These two political parties, have existed since the 1800s and have often been political rivals in the US government. Currently, the Democratic Party is known to be a left-wing political party while the Republican Party is considered as a right-wing political party.
However, their political ideologies and ideas have undergone significant shifts throughout the years. This begs the question: Can we analyze how the Democratic and Republican parties’ ideologies have shifted throughout US history?
Gathering the Data
Gathering the Data
First, I decided to obtain the two party’s party platforms from The American Presidency Project by UC Santa Barbara. Both the Democratic Party and Republican Party publish a party platform every four years, which is a lengthy document that explains their stances on political issues and values that will guide the party. Since the party platforms are an official description of the ideologies of the two political parties, these were the primary data used for analysis.
The website only included party platforms up to 2020, as this project was created before the Democratic and Republican Party conventions, which is when they publish their party platform. As a result, this project could only use party platforms up to the year 2020.
For this project, only party platforms between the years 1900 and 2020, inclusive, will be used for analysis.
The website was a table of political party platforms by presidential election year with a hyperlink to a separate page that featured the party platform.
The code below gets a list of all of the hyperlinks that are in the main page of the list of party platforms. I used a pattern to selected all of the links connected to the Democratic Party Platform.
In[]:=
democrats=Flatten[Select[StringCases[Import["https://www.presidency.ucsb.edu/documents/presidential-documents-archive-guidebook/party-platforms-and-nominating-conventions-3","Hyperlinks"],___~~"-democratic-party-platform"],Length[#]>0&]];
The code below does the same action as the previous code, but collects all of the hyperlinks connected to the Republican Party platforms.
In[]:=
republicans=Flatten[Select[StringCases[Import["https://www.presidency.ucsb.edu/documents/presidential-documents-archive-guidebook/party-platforms-and-nominating-conventions-3","Hyperlinks"],___~~"republican-party-platform"~~___],Length[#]>0&]];
Using the list of hyperlinks that I obtained for each party, I imported the HTML code from each of the pages. Then, I only took the the text that is inside the HTML div tag with the id “field-docs-content”. This is because this div tag contained the content of the web page, which were the party platforms. It also removes all of the HTML tags that are located within the text.
The code below obtains all of the Democratic Party’s party platforms.
The code below obtains all of the Democratic Party’s party platforms.
In[]:=
demtexts=StringTake[StringReplace[StringCases[Import[#,"Text"],Shortest["field-docs-content"~~___~~"</div>"]][[1]],Shortest["<"~~__~~">"]->""],21;;-1]&/@democrats[[1;;31]];
The code below gathers all of the Republican Party’s party platforms.
In[]:=
reptexts=StringTake[StringReplace[StringCases[Import[#,"Text"],Shortest["field-docs-content"~~___~~"</div>"]][[1]],Shortest["<"~~__~~">"]->""],21;;-1]&/@republicans[[3;;32]];
This project will not use the 2020 statement from the Republican Party because the party cancelled the 2020 Republican Convention due to the COVID-19 pandemic and the document is an affirmation of the reuse of the 2016 Republican Party platform. As a result, the the 2020 Republican Party platform can be considered as the same as that of 2016. This project will also not use the 2024 party platform from the Republican Party as the 2024 party platform for the Democratic Party was not yet published at the time of this writing this essay.
Visualizing Party Platforms using Principal Components Analysis
Visualizing Party Platforms using Principal Components Analysis
When analyzing similarities between texts and clustering, a large number of dimensions and features will be used, which leads to many issues such as overfitting, scarcity of data, and the inability to represent more than three dimensions.
Principal Components Analysis is a way around this issue by reducing the number of dimensions to a set of “principal components” that still capture the most important patterns and maximize the variance within the data. When using text, vector embedding will be used to convert the text into numbers that describe the characteristics of the text. These values will be used in PCA.
PCA was used to visualize how the Democratic and Republican party platforms change by plotting them on a 2-dimensional graph and comparing where they lie.
The first dimension of the graph would be the first principal component, which captures the most variation, and the second dimension would be the second principal component, which captures the most variance orthogonal to the first component. Although what the principal components exactly are will not be discussed in the project, it allows for an abstract visualization of the shifts of the political parties.
Preprocessing the Data
Preprocessing the Data
Using the texts of the party platforms that I had obtained, I decided to create an association where the key was the year and political party and the value was the party platform. This will be used to label the points when we perform the principal components analysis.
The bottom code creates two associations for Democratic and Republican Party’s platforms and then creates a large association that would include all platforms.
The bottom code creates two associations for Democratic and Republican Party’s platforms and then creates a large association that would include all platforms.
In[]:=
demKeys=Table[StringJoin[ToString[2024-4*i]," Democratic Party"],{i,Range[Length[demtexts]]}];
In[]:=
democratTexts=Association[Table[demKeys[[i]]->demtexts[[i]],{i,Range[Length[demtexts]]}]];
In[]:=
repKeys=Table[StringJoin[ToString[2020-4*i]," Republican Party"],{i,Range[Length[reptexts]]}];
In[]:=
republicanTexts=Association[Table[repKeys[[i]]->reptexts[[i]],{i,Range[Length[reptexts]]}]];
In[]:=
allTexts=Join[democratTexts,republicanTexts];
Performing Principal Components Analysis on All Party Platforms
Performing Principal Components Analysis on All Party Platforms
The function below returns the color Red if the input ends with “Republican Party” and Blue if the input ends with “Democratic Party”. This is in order to color the points on the graph based on the colors of the political party that the party platform was published by.
In[]:=
partyColors[p_]:=If[StringTake[p,6;;-1]=="Republican Party",Red,Blue]
The code below performs principal component analysis on all of the party platforms and plots each of the party platforms on a graph.
In[]:=
ResourceFunction["DragZoomShow"][ListPlot[MapThread[Callout[Style[#1,#2],#3,LabelStyle->Tiny]&,{DimensionReduce[Flatten[Values[allTexts]],2,Method->"PrincipalComponentsAnalysis",FeatureExtractor->{ToUpperCase}],partyColors/@Keys[allTexts],Keys[allTexts]}],ImageSize->Full,PlotRangePadding->{10,100}]]
Out[]=
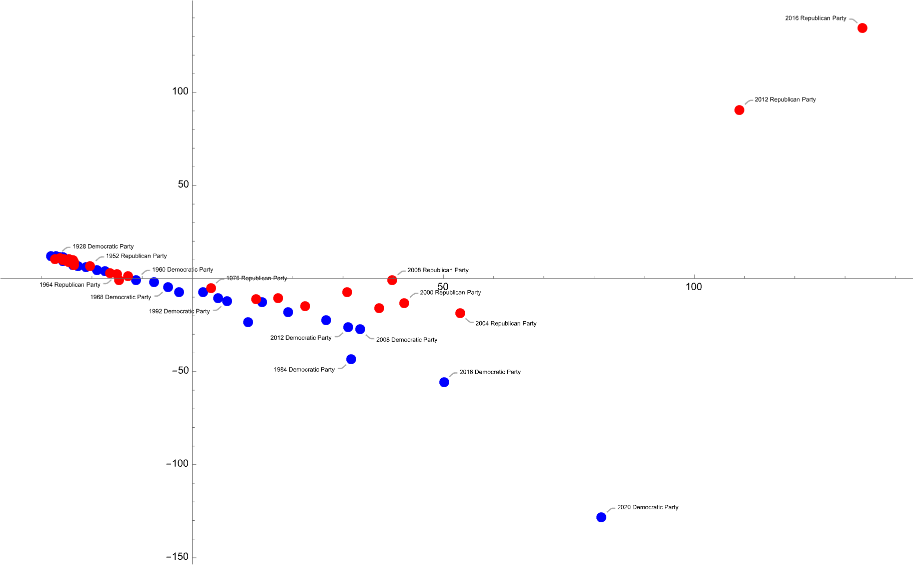
In the graph, it is shown that for both the Democratic and Republican Party, the platforms are generally going chronologically from left to right. However, additionally, although the Republican and Democratic Party are at relatively similar positions in the first half of the 20th century, starting from the 1960s and 1970s, a divide between the two parties becomes increasingly clear. This is especially true in the last 20 years, as seen in the graph, where the Republican Party has started to go increasingly higher while the Democratic Party is going increasingly lower.
This correlates with the ideological shift between the Republican and Democratic Party during the mid-1900s, when the Democratic Party shifted towards supporting civil rights, which alienated its traditional Southern voters who then moved to the Republican Party. The increasing polarization and partisan nature of American politics during the 21st century was also shown in the drastic separation between the two political parties in the graph.
This correlates with the ideological shift between the Republican and Democratic Party during the mid-1900s, when the Democratic Party shifted towards supporting civil rights, which alienated its traditional Southern voters who then moved to the Republican Party. The increasing polarization and partisan nature of American politics during the 21st century was also shown in the drastic separation between the two political parties in the graph.
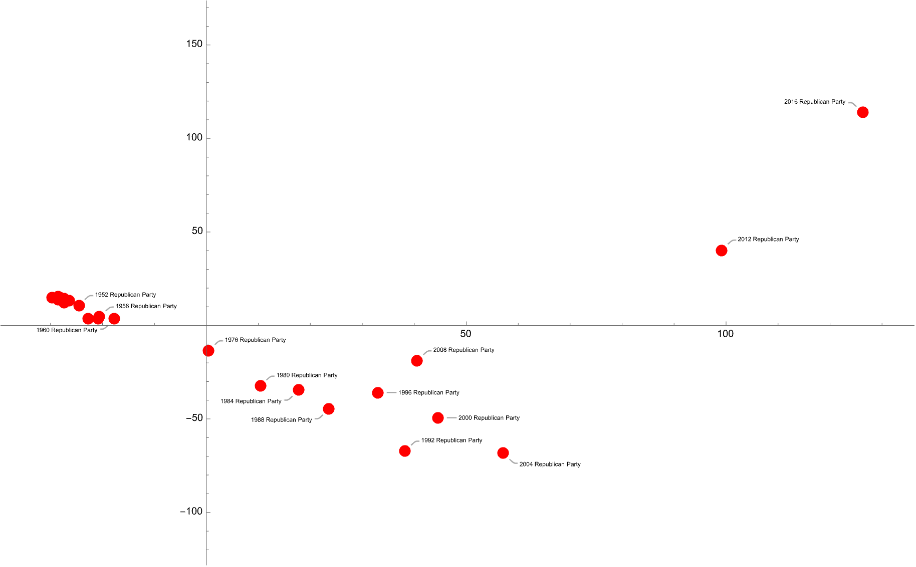
I also created two separate graphs that shows only the shift of the Republican Party and Democratic Party.
Principal Components Analysis on the Republican Party’s Party Platforms
Principal Components Analysis on the Republican Party’s Party Platforms
In[]:=
ResourceFunction["DragZoomShow"][ListPlot[MapThread[Callout[Style[#1,#2],#3,LabelStyle->Tiny]&,{DimensionReduce[Flatten[Values[republicanTexts]],2,Method->"PrincipalComponentsAnalysis",FeatureExtractor->{ToUpperCase}],partyColors/@Keys[republicanTexts],Keys[republicanTexts]}],ImageSize->Full,PlotRangePadding->{10,60}]]
Out[]=
Principal Components Analysis on the Democratic Party’s Party Platforms
Principal Components Analysis on the Democratic Party’s Party Platforms
In[]:=
ResourceFunction["DragZoomShow"][ListPlot[MapThread[Callout[Style[#1,#2],#3,LabelStyle->Tiny]&,{DimensionReduce[Flatten[Values[democratTexts]],2,Method->"PrincipalComponentsAnalysis",FeatureExtractor->{ToUpperCase}],partyColors/@Keys[democratTexts],Keys[democratTexts]}],ImageSize->Full,PlotRangePadding->{10,160}]]
Out[]=
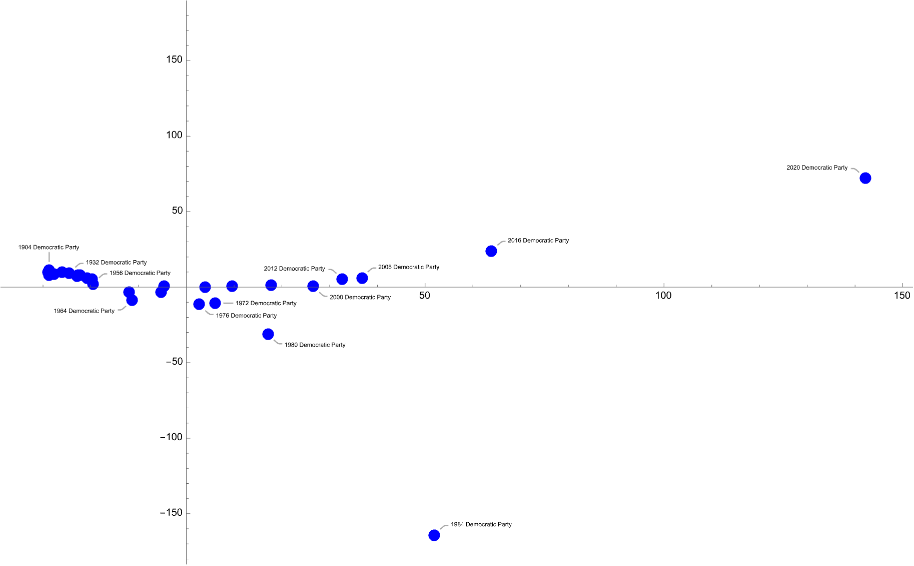
One notable exception to the pattern of the shifts of the political parties is the 1984 Democratic Party, which can be shown in the Democratic Party’s graph and the overall graph to be much further away from party platforms from similar time periods.
The president of the United States during this year was Ronald Reagan, who is known to have transformed the Republican Party and American politics as a whole by becoming the charismatic leader of conservatism and introducing it into mainstream politics. He brought the rise of a new conservative movement in the Republican Party and coupled with his popularity throughout the nation, the Democratic Party may have felt threatened and prompted to be more opposed to the Republican Party than previous years. In fact, the term “Reagan” appears 197 terms in the party platform for that year, referencing an member of the opposing party much more than other party platforms during this time. In the end, the Democratic nominee for that year, Walter Mondale, ended up losing in a massive landslide against Reagan.
The president of the United States during this year was Ronald Reagan, who is known to have transformed the Republican Party and American politics as a whole by becoming the charismatic leader of conservatism and introducing it into mainstream politics. He brought the rise of a new conservative movement in the Republican Party and coupled with his popularity throughout the nation, the Democratic Party may have felt threatened and prompted to be more opposed to the Republican Party than previous years. In fact, the term “Reagan” appears 197 terms in the party platform for that year, referencing an member of the opposing party much more than other party platforms during this time. In the end, the Democratic nominee for that year, Walter Mondale, ended up losing in a massive landslide against Reagan.
How the Party Platforms Change Based on Specific Issues and Aspects
How the Party Platforms Change Based on Specific Issues and Aspects
Unfortunately, solely using principle components analysis on the party platforms does not give the actually ways or reasons why the sudden separation in the graph occurred. Although it can be inferred that it is due to the increasing polarization of American politics, it cannot be proven by the dimension reduction alone.
As a result, natural language processing can be used to determine in what specific ways the party platforms are different.
As a result, natural language processing can be used to determine in what specific ways the party platforms are different.
Word count of the Opposing Party’s Nominee
Word count of the Opposing Party’s Nominee
First, the word count of the opposing party’s nominee of that year’s election in the party platform can determine how often the two parties engage in negative campaigning. Negative campaigning is a tactic used in politics where instead of focusing on the positive impacts or appeals of the candidate, they would try to damage the reputation or criticize the opposing candidate to shape them into someone who seems unfit for office. Some examples could be exposing scandals, fear-mongering, or attacking the opponent’s character.
Although negative campaigning may be effective in some cases, it also leads to heightened political attacks against both candidates instead of constructive dialogue about political issues, which is a trait of what is known as “dirty” politics. It could also spread false or exaggerated claims about the candidates during elections. This can lead to an increased divide between the two political parties.
Since negative campaigning can be a sign of division between the two political parties, it was clear that there could be a pattern in the amount of negative campaigning on the party platform as time passed. This was done by finding what percentage of the words were the last name of the opponent. The last name was chosen instead of the first name because the last name is more commonly used in formal documents.
First, the party nominees were found by looking at Britannica’s article on the historical results of US elections. The code below is a list of the last name of the Republican nominee from the year 2020 to 1900.
Next, the amount of occurrences of the name in the Democratic Party’s party platform was divided by the number of words in the document to find a percentage. Then, I created a bar chart that showed that percentage for each party platform. This is the resulting bar graph for the Democratic Party.
The code below shows the same process but instead for the Republican Party. Since the party platform for the Republican Party is only available up to 2016, only Democratic nominees between the year 2016 and 1900, inclusive, were considered.
Although there is no clear pattern, it is evident that negative campaigning has increased in both the Republican and Democratic parties during the late 1900s and the 2000s compared to the early half of the 1900s.
It can also be seen that recently, there has been a spike in the mention of the nominee if the nominee is president and is running for a second term. This is true for every such nominee since Dwight D. Eisenhower in 1956 for the Democratic Party and Jimmy Carter in 1980 for the Republican Party. This is most likely as they were president at the time and enacted policies, there are more opportunities for constructive or specific criticisms towards the opponent since it is based on actual actions instead of what they say.
However, this is not a perfect visualization of negative campaigning as the party platform could have also attacked different politicians, such as an administration from the past, and the party as a whole.
Neutral/Partisan Classification
Neutral/Partisan Classification
To analyze the degree of partisanship in the party platforms, natural language processing was used to classify to what degree every sentence in the party platform was partisan. After training a classifying model using a labeled dataset, the mean percentage of each sentence being partisan was used to determine the degree of partisanship. The dataset used for training the model was a table of 5000 social media posts from US politicians labeled as neutral or partisan. This dataset is from Crowdflower’s Data For Everyone Library.
First, the data from the file was turned into a list of lists, where each inner list contains the elements of the corresponding row.
Then, a new association was made where the key would be the text and the value would be the label; either partisan or neutral. All of the stop words and punctuation were removed from the text to only obtain the words that are useful for classification.
The association was then inputted into the Classify function to create a model, neutPartF, which would be able to model a text as partisan or neutral. The classifier method used was the Markov method, which was chosen automatically.
The Markov analysis is a stochastic method that only looks at the present value of the variable and not look at any prior values. This is a valid method as the text does not need to be classified as neutral or partisan based on any other value other than the text itself.
The Markov analysis is a stochastic method that only looks at the present value of the variable and not look at any prior values. This is a valid method as the text does not need to be classified as neutral or partisan based on any other value other than the text itself.
Then, after classifying each sentence as partisan or neutral, the probability of each sentence being identified as partisan was averaged to find the overall score for the party platforms. Using the values, a bar graph was created to easily visualize the result.
The code below shows the results for the Democratic Party.
The code below shows the results for the Democratic Party.
The code below shows the results for the Republican Party.
As it is clearly shown, there is no reliable pattern on how the partisanship of the party platforms changes for both political parties. All party platforms are generally placed between 0.83 and 0.97 with little variation as time passes. This shows that the degree of partisanship in the political parties did not change much as time passed.
Although this might seem to oppose the accepted state of polarization in American politics, the two do not have to necessarily correlate with each other. The results shown in the bar graph do not show how polarizing the content is between the two parties but only to what degree the statements made are political and partisan. For example, it is possible that both parties outlined the same stance on a political issue but were still considered partisan because they are supporting a specific cause, even if it is the same cause.
Considering that the documents analyzed are the party platforms of political parties, it is valid that there is a high degree of partisanship in all of the party platforms that were analyzed.
Clustering and Finding Topics in Similar Party Platforms in Democrat and Republican Parties
Clustering and Finding Topics in Similar Party Platforms in Democrat and Republican Parties
The final part of the research was to find how similar the party platforms of each party were to those of other years and how the topics that were discussed in these party platforms differed. This would allow for an analysis of how the party platforms are similar and how these topics changed over time. This part of the research was inspired by Salomon Orellana and Halil Bisgin’s research paper from 2023 where they analyzed the changing ideologies of New Zealand’s political parties.
UMAP
UMAP
The first phase of this part was to cluster similar party platforms together. This was done by creating vector embeddings of the documents and then performing a different dimension reduction algorithm called Uniform Manifold Approximation and Projection (UMAP). UMAP is a type of non-linear where the very high-dimensional data points are assumed to be on a Riemannian manifold, which means that they can be approximated on an Euclidean space. Using this concept, UMAP reduces the data into a 2-D space while preserving the topological structure of the data points.
The code below performs UMAP on the vector embeddings of the party platforms of the Democratic and Republican Parties.
DBSCAN
DBSCAN
Next, the UMAP values were clustered using a method known as density-based spatial clustering of applications with noise (DBSCAN). DBSCAN is a way to cluster different data points by calculating the density of the clusters based on a neighbor-based algorithm, or by clustering data points that are most close to each other. However, the algorithm also identifies outliers, which would go into a separate cluster. By clustering the dimension-reduced data points, it would thus cluster similar party platforms together.
The code below finds clusters of the Democratic party platforms and plots them on a graph.
The code below finds the clusters for the Republican Party.
This code outputs a table of all of clusters and what Democratic party platforms are in each cluster.
The code below finds the same table but for the Republican Party.
Although there are a few exceptions, such as Cluster 4 from the Republican Party and Cluster 5 from the Democratic Party, all of the clusters generally have party platforms from similar timeframes. This shows that party platforms in similar timeframes have similar topics.
TFIDF Scores
TFIDF Scores
Then, in order to find the most important topics of each cluster, a measure known as the term frequency-inverse document frequency (TF-IDF) was used. TF-IDF is a statistical measure that gives a score for each word in a document on how relevant the word is to that document.
This score is found by multiplying the TF score and the IDF score. The TF score is the number of occurrences of the word divided by the total number of words in the document. This score checks how often the word occurs in a document. The IDF score is the natural log of the number of documents in the corpus by the number of documents that contain the word. The IDF score finds how rare the word is in the whole corpus and the natural log keeps the IDF score from dominating over the whole TF-IDF score as the TF score is between 0 and 1.
The TF-IDF score puts more importance on words that are rare in the whole corpus but are common in the document. The higher the TF-IDF score is, the more important the word is. Thus, the more important words could give an idea of what the general topic or subject of the document is.
Before finding the TF-IDF scores, I removed all of the stop words and numbers from the documents and only chose to look at the nouns since we were trying to determine the topic. Additionally, in order for the code to differentiate between words with the same stem, such as “programs” and “program,” I chose to only consider the word stems.
Then, I considered each cluster as one document and obtained the TF-IDF score of all the words. Then, the top 10 words with the highest score for each cluster were output into a table. These words can be considered as topics that define each group as they are the most relevant to the cluster.
The code below finds the TFIDF scores of all of the words in each cluster for the Democratic Party.
The code below does the same operation but for the Republican Party.
This grid has the top topics for each cluster of the Democratic Party.
To figure out what topics define each cluster, it is helpful to correlate the top words with the historical context of the party platforms.
Cluster 1 seems to be defined by health, technology, and Communism. Cluster 2 focuses on health and students as well as the pandemic, its economic effects, and the climate. Cluster 3 is defined by technology of that time, such as waterpower and telegraphs, while also regarding war and agriculture. Cluster 4 reflects historical events of that time period, which is before, during, and after World War I, such as the League of Nations (leagu), women’s suffrage (suffrag), and the Panic of 1907 (panic). Cluster 5 is defined by health, especially drugs, as well as technology and the Soviet Union. Cluster 6 is defined by the Soviet Union, health, and the elderly. Cluster 7 is defined by the economy, the Prohibition, and war, reflecting the economic issues from that time and World War II. Cluster 8 is defined by the army and social principles of that time. Cluster 9 focuses most on the Soviet Union, especially on defense from Communism and atomic weapons. Cluster 10 is defined by the youth, defense, health, and electricity. Cluster 11 is also defined by drugs but also family, technology, homeless, health, and weapons. Cluster 12 is also defined by agriculture and League of Nations.
Cluster 1 seems to be defined by health, technology, and Communism. Cluster 2 focuses on health and students as well as the pandemic, its economic effects, and the climate. Cluster 3 is defined by technology of that time, such as waterpower and telegraphs, while also regarding war and agriculture. Cluster 4 reflects historical events of that time period, which is before, during, and after World War I, such as the League of Nations (leagu), women’s suffrage (suffrag), and the Panic of 1907 (panic). Cluster 5 is defined by health, especially drugs, as well as technology and the Soviet Union. Cluster 6 is defined by the Soviet Union, health, and the elderly. Cluster 7 is defined by the economy, the Prohibition, and war, reflecting the economic issues from that time and World War II. Cluster 8 is defined by the army and social principles of that time. Cluster 9 focuses most on the Soviet Union, especially on defense from Communism and atomic weapons. Cluster 10 is defined by the youth, defense, health, and electricity. Cluster 11 is also defined by drugs but also family, technology, homeless, health, and weapons. Cluster 12 is also defined by agriculture and League of Nations.
This grid has the top topics for each cluster of the Republican Party.
Defence, patriotism, and the economy are defining features of Cluster 1. Cluster 2 is defined by Communism, military, and racial issues. Cluster 3 is defined by teamwork and the military (rearmament). Cluster 4 focuses on terrorism, due to the September 11 Attacks, leadership, and technology. Cluster 5 is defined by technology and families. Cluster 6 is focused on the Soviet Union, militaries, and neighborhoods. Cluster 7 is defined by leadership, militaries, and poverty. Cluster 8 is defined by defence, telegraphs, and army. Cluster 9 is defined by the Prohibition (eighteenth amendment) and development. Cluster 10 is defined by the Soviet Union, technology, families, and support for democracy. Cluster 11 is defined by economic and social issues (sweatshop, devalu). Cluster 12 is defined by healthcare, jobs, abortion, technology, and the Internet.
Conclusion
Conclusion
It is clear that between the years 1900 and 2020, both parties’ ideologies have changed significantly. The two parties have started to increasingly diverge from each other starting from the latter half of the 1900s and early 2000s, reflecting the increasing polarization of American politics. Additionally, there was an increase in negative campaigning for both parties toward their opponent during election years in the late 1900s and the 2000s compared to the early 1900s. Finally, although the party platforms continued to have a similar degree of partisanship, the specific topics that each of the party platforms focused on have changed as time passed, such as a lesser focus on Communism in party platforms today compared to the late 1900s and reflect specific historical events during the time, such as the COVID-19 Pandemic and the invention of the Internet. However, there were still some topics that continued to be prevalent, such as public health, the military, and the economy.
Future Work
Future Work
Throughout the course of the development of this research project, I had to change the direction of the project multiple times, which I would like to accomplish in the future. One of the main aspects that I would like to add in the future is classifying the party platforms into different political typology groups. Pew Research outlined nine different typology groups and I would like to find a way to classify the party platforms to one of these groups. Another major aspect that I would like to add to my work is the classification of the degree of liberalism and conservatism in each of the party platforms and modeling how that changes as time changes. Finally, I would also like to model the change in each of the party’s stances on specific political issues, such as gun rights, using classification.
References
References
◼
Britannica, The Editors of Encyclopaedia. “Democratic Party”. Encyclopedia Britannica, 10 Jul. 2024, https://www.britannica.com/topic/Democratic-Party. Accessed 10 July 2024.
◼
Britannica, The Editors of Encyclopaedia. “Republican Party”. Encyclopedia Britannica, 9 Jul. 2024, https://www.britannica.com/topic/Republican-Party. Accessed 10 July 2024.
◼
Britannica, The Editors of Encyclopaedia. “United States Presidential Election Results”. Encyclopedia Britannica, 27 Aug. 2023, https://www.britannica.com/topic/United-States-Presidential-Election-Results-1788863. Accessed 10 July 2024.
◼
Crowdflower. “Political Social Media Posts.” Kaggle, Kaggle, 20 Nov. 2016, www.kaggle.com/datasets/crowdflower/political-social-media-posts/data.
◼
Eldridge, Stephen. “political spectrum”. Encyclopedia Britannica, 8 Jun. 2024, https://www.britannica.com/topic/political-spectrum. Accessed 10 July 2024.
◼
Gerhard Peters. “Political Party Platforms of Parties Receiving Electoral Votes.” The American Presidency Project. Ed. John T. Woolley and Gerhard Peters. Santa Barbara, CA: University of California. 1999-2024. www.presidency.ucsb.edu/node/324129
◼
Kenton, Will. “Markov Analysis: What It Is, Uses, and Value.” Investopedia, Investopedia, 14 Feb. 2021, www.investopedia.com/terms/m/markov-analysis.asp.
◼
Kupferberg, Jono. “Negative Campaigning.” What Is Negative Campaigning and Is It Worth the Risk?, HubDialer, 14 Apr. 2023, www.hubdialer.com/glossary/what-is-negative-campaigning/.
◼
Orellana, Salomon, and Halil Bisgin. “Using Natural Language Processing to Analyze Political Party Manifestos from New Zealand.” MDPI, Multidisciplinary Digital Publishing Institute, 1 Mar. 2023, doi.org/10.3390/info14030152.
◼
“Principal Component Analysis(PCA).” GeeksForGeeks, GeeksForGeeks, 6 Dec. 2023, www.geeksforgeeks.org/principal-component-analysis-pca/.
◼
“The Reagan Presidency.” Ronald Reagan Presidential Library and Museum, Ronald Reagan Presidential Library and Museum, www.reaganlibrary.gov/reagans/reagan-administration/reagan-presidency. Accessed 10 July 2024.
◼
Turkel, William J. “Basic Text Analysis in Mathematica.” William J Turkel, 19 Nov. 2012, williamjturkel.net/2012/11/19/basic-text-analysis-in-mathematica/.
◼
“UMAP: Uniform Manifold Approximation and Projection.” GeeksforGeeks, GeeksforGeeks, 3 July 2024, www.geeksforgeeks.org/umap-uniform-manifold-approximation-and-projection/.
◼
Wolfram, Christopher. “Dimensionality of Politics.” Christopher Wolfram, Sept. 2023, christopherwolfram.com/projects/dimensionality-of-politics/.
◼
Wolfram. “’DBSCAN’ (Machine Learning Method).” DBSCAN-Wolfram Language Documentation, Wolfram Research, 2020, reference.wolfram.com/language/ref/method/DBSCAN.html.
Acknowledgements
Acknowledgements
I would like to thank my mentor, Jack Heseltime, and my teacher’s assistant, Nicoló Mopti for their infinite patience, their constant assistance throughout this project, and their willingness to guide me through my first-ever research project.
CITE THIS NOTEBOOK
CITE THIS NOTEBOOK
Analyzing changes in the ideology of the Democratic and Republican party from 1900 to 2020
by Eugene Hwang
Wolfram Community, STAFF PICKS, July 11, 2024
https://community.wolfram.com/groups/-/m/t/3213886
by Eugene Hwang
Wolfram Community, STAFF PICKS, July 11, 2024
https://community.wolfram.com/groups/-/m/t/3213886