Laminar Friction Factors for Rectangular Ducts
Authors: Housam Binous and Ahmed Bellagi
Laminar Friction Factors for Rectangular Ducts
Authors: Housam Binous and Ahmed Bellagi
Authors: Housam Binous and Ahmed Bellagi
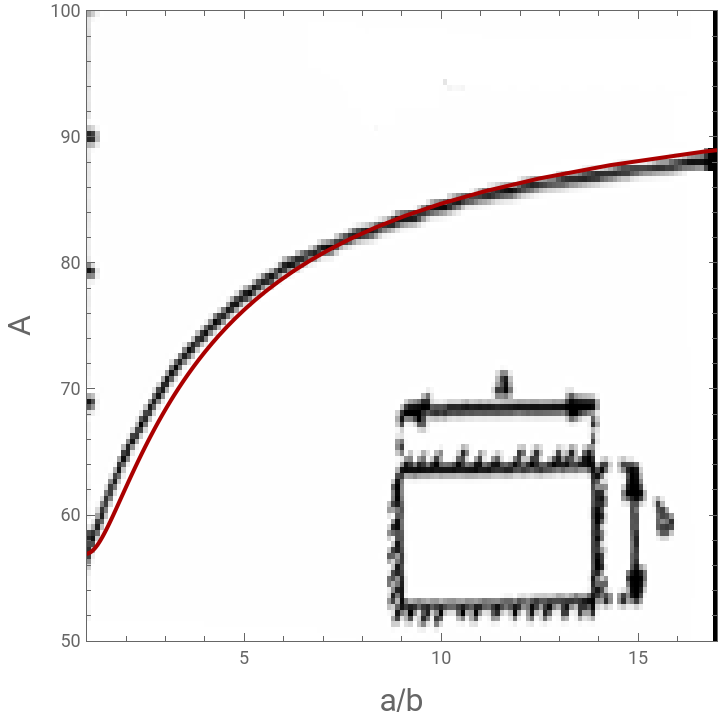
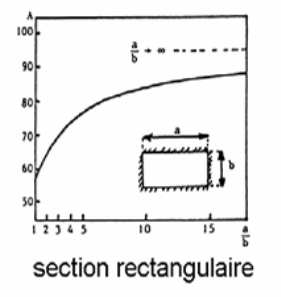
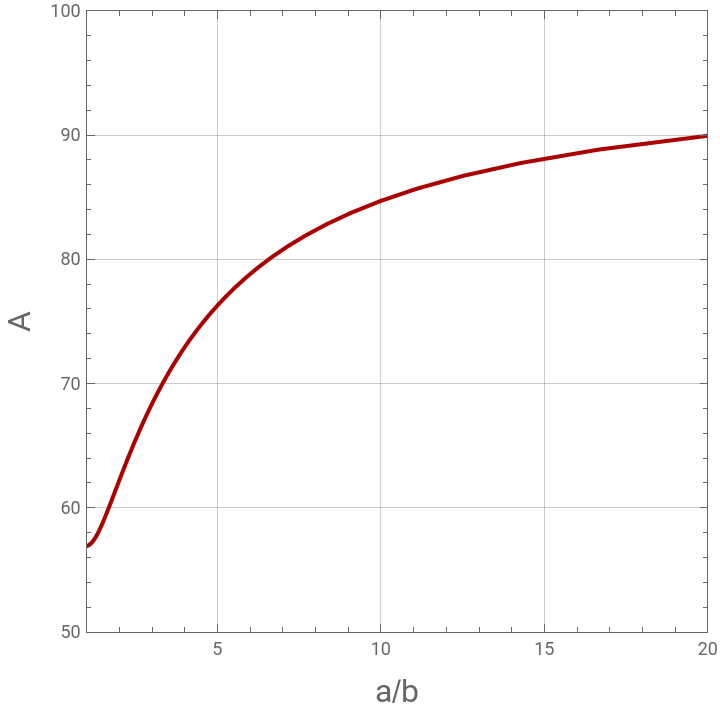
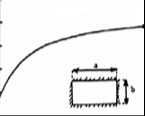
The friction factors for rectangular ducts at low Reynolds numbers are given by where depends on a/b as follows (see Ref. 1): Some numerical values of are given in Table 42 of Ref. 1. Here, we reproduce this Table but for the Darcy friction factor.A plot of A versus a/b has been reported previously. Here, we also plot A versus a/b.References:[1] R. K. Shah, A. L. London, Thomas F. Irvine and James P. Hartnett, Laminar Flow Forced Convection in Ducts: A Source Book for Compact Heat Exchanger Analytical Data (Advances in Heat Transfer. Supplement), NY: Academic Press, 1978.
f=
A
Re
Dh
A
A=f=96(1-1.3553α+1.9467-1.7012+0.9564-0.2537)
Re
Dh
2
α
3
α
4
α
5
α
f*
Re
Dh
In[]:=
(*ConstantAforlaminarflow*)Correctionfactor[alpha_]:=96(1-1.3553alpha+1.9467alpha^2-1.7012alpha^3+0.9564alpha^4-0.2537alpha^5);
In[]:=
alphaTable={1,0.9,1/1.2,0.8,0.75,1/1.4,0.7,2/3,0.6,0.5,0.4,1/3,0.3,0.25,0.2,1/6,1/7,0.125,1/9,1/10,1/12,1/15,1/20,1/50,0};(*seeRef.1*)
In[]:=
(*DataintheformofaTablesimilartoTable6.3ofRef.2*)Grid[Prepend[Transpose[{alphaTable,Correctionfactor[alphaTable]}],{"Radius ratio b/a","f*Re_Dh or A"}],Frame->All,Background->{None,{Lighter[Blend[{Blue,Red}],.3],{Lighter[Blend[{Blue,Darker@Red}],.8],Lighter[Red,.9]}}},ItemSize->{8.4,2.0},Frame->Darker[Gray,.6],ItemStyle->14,Spacings->{Automatic,.8}]
Out[]=
Radius ratio b/a | f*Re_Dh or A |
1 | 56.9184 |
0.9 | 57.0786 |
0.833333 | 57.3349 |
0.8 | 57.5273 |
0.75 | 57.9126 |
0.714286 | 58.2681 |
0.7 | 58.4308 |
2 3 | 58.8592 |
0.6 | 59.9419 |
0.5 | 62.2293 |
0.4 | 65.5067 |
1 3 | 68.3798 |
0.3 | 70.0619 |
0.25 | 72.9361 |
0.2 | 76.2862 |
1 6 | 78.818 |
1 7 | 80.7876 |
0.125 | 82.3591 |
1 9 | 83.6402 |
1 10 | 84.7036 |
1 12 | 86.3652 |
1 15 | 88.1101 |
1 20 | 89.9419 |
1 50 | 93.4713 |
0 | 96. |
In[]:=
ListPlot[Table[{1/alpha,Correctionfactor[alpha]},{alpha,0.01,1,0.01}],PlotRange->{{1.0,20},{50,100}},Frame->True,GridLines->Automatic,PlotStyle->Darker@Red,AspectRatio->1,Joined->True,FrameLabel->{Style["a/b",16],Style["A",16]}]
Out[]=
In[]:=
p=ListPlot[Table[{1/alpha,Correctionfactor[alpha]},{alpha,0.01,1,0.01}],PlotRange->{{1.0,17.},{50,100}},Frame->True,GridLines->Automatic,PlotStyle->Darker@Red,AspectRatio->1,Joined->True,FrameLabel->{Style["a/b",16],Style["A",16]}];
In[]:=
img=
;
In[]:=
Show[p,Prolog->{Raster[ImageData[img,DataReversed->True],{Scaled[{0.0,-0.05}],Scaled[{1,1}]}]}]
Out[]=