The Maxwell Speed Distribution
The Maxwell Speed Distribution


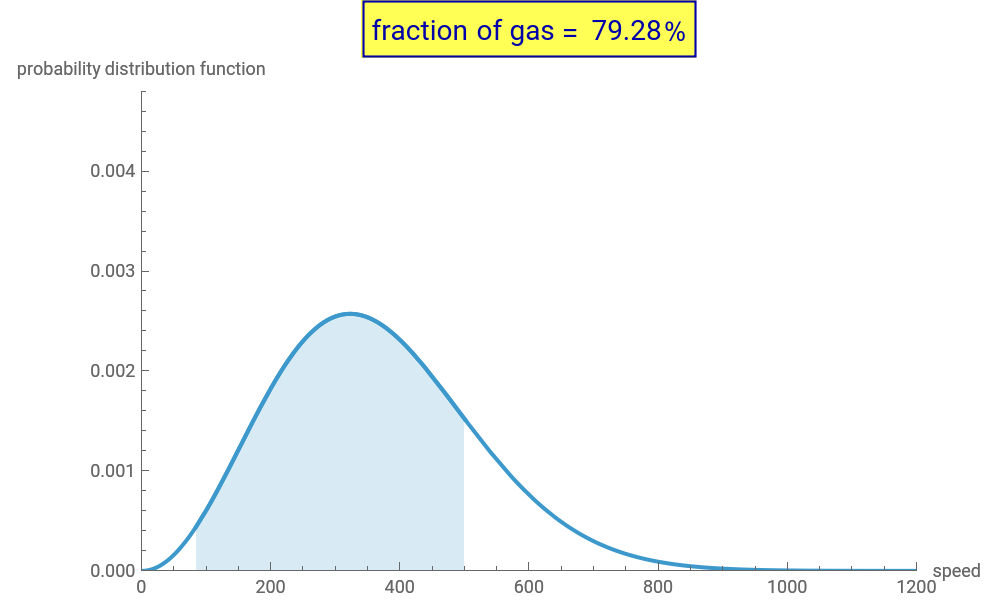
This Demonstration shows an interactive plot of Maxwell's law for the molecular speed
distribution of an ideal gas (1852). You can see an arbitrary speed interval (the light blue area under the graph) and get the fraction of gas molecules that correspond to those speeds (in the yellow box). When you check "show speed" button the most probable speed (red line), average speed (orange line) and root mean square speed (blue line) of the molecules is calculated. Note the default molecular mass is set for oxygen molecules.
distribution of an ideal gas (1852). You can see an arbitrary speed interval (the light blue area under the graph) and get the fraction of gas molecules that correspond to those speeds (in the yellow box). When you check "show speed" button the most probable speed (red line), average speed (orange line) and root mean square speed (blue line) of the molecules is calculated. Note the default molecular mass is set for oxygen molecules.
External Links
External Links
Permanent Citation
Permanent Citation
Jan Fiala
"The Maxwell Speed Distribution"
http://demonstrations.wolfram.com/TheMaxwellSpeedDistribution/
Wolfram Demonstrations Project
Published: March 7, 2011