Tafel Curve in Electrochemistry
Tafel Curve in Electrochemistry


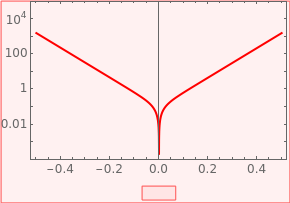
The Tafel curve is widely used in electrochemistry, especially in the study of corrosion. Using the Tafel curve one can determine the corrosion potential or open circuit potential. The coefficient of charge transfer can also be determined as the slope of the Tafel curve. This Demonstration shows the current-potential curve on the left and the Tafel curve, (current)potential on the right.
E
corr
α
log
10
vs
Details
Details
The current-potential curve on the left obeys the Butler–Volmer equation for a kinetic-controlled reaction,
i=nFA-exp-α(E-)+exp(1-α)(E-)
k
0
c
O
nF
RT
E
0
c
R
nF
RT
E
0
where is the charge transfer coefficient, is the number of electrons transferred, is Faraday's constant, is temperature, is the gas constant, and are the concentrations of oxidant and reductant, is the standard rate constant, and is the standard potential or corrosion potential =.
α
n
F
T
R
c
O
c
R
k
0
E
0
E
corr
E
0
Thei potential curve on the right is the Tafel curve.
log
10
For high overpotential ,
E>>
E
0
log
10
log
10
k
0
c
R
nF
RT
log
10
E
0
So the anodic slope is ; as increases, this slope decreases.
(1-α)
nF
RT
α
For large negative potential ,
E<<
E
0
log
10
log
10
k
0
c
O
nF
RT
log
10
E
0
Thus the absolute value of cathodic slope is ; as increases, the slope increases.
α
nF
RT
α
The Tafel slope can be used to calculate the charge transfer coefficient and the corrosion potential =.
α
E
corr
E
0
External Links
External Links
Permanent Citation
Permanent Citation
Quang-Dao Trinh
"Tafel Curve in Electrochemistry"
http://demonstrations.wolfram.com/TafelCurveInElectrochemistry/
Wolfram Demonstrations Project
Published: June 8, 2011