Rovibronic Spectrum of a Parallel Band of a Symmetric Rotor
Rovibronic Spectrum of a Parallel Band of a Symmetric Rotor
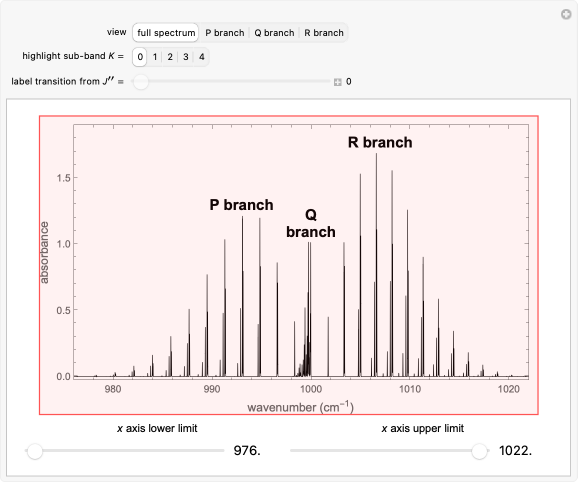
This Demonstration shows the rotationally resolved infrared spectrum of a parallel band of a symmetric rotor, with transitions occurring between nondegenerate vibrational levels. Symmetric rotors include ammonia , benzene , and the methyl halides , where can be , , , or ). Symmetric rotors have two equal moments of inertia; the axis with the unique moment of inertia is termed the principle axis. For a symmetric rotor, the direction of the change in dipole moment, or transition moment, determines the appearance of the spectrum because different selection rules must be satisfied. If the transition moment is parallel to the principal axis, as in this Demonstration, a parallel band spectrum results. On the other hand, if the transition moment is perpendicular to the principal axis, a perpendicular band spectrum results. Hybrid bands can result if the transition moment has a component both parallel and perpendicular to the principal axis. For a parallel band, the vibrational selection rules are and the rotational selection rules are , if and , , if , with the restriction that . If the complete band spectrum is deconstructed, it appears as a superposition of sub-bands. Each sub-band corresponds to a value and consists of a branch (, , , smaller wavenumbers), branch (, , , middle branch, appears when ), and branch (, , , larger wavenumbers). Due to the restriction that , with increasing a decreasing number of lines are observed within each sub-band. The observed line intensities reflect a dependence on the thermal population of the ground state energy levels (determined by the Boltzmann factor) and the quantum numbers and . With this Demonstration you can view the full spectrum and each branch individually. When viewing each branch individually, you can deconstruct the complete band by choosing which sub-band to highlight and by labeling individual lines/transitions within the sub-band. By using the axis lower and upper limit controls, you can zoom in on any region of the spectrum.
()
NH
3
()
C
6
H
6
(X
CH
3
X
F
Cl
Br
I
Δv=±1
ΔK=0
ΔJ=±1
K=0
ΔK=0
ΔJ=0
±1
K≠0
J≥K
K
P
Δv=+1
ΔK=0
ΔJ=-1
Q
Δv=+1
ΔK=0
ΔJ=0
K≠0
R
Δv=+1
ΔK=0
ΔJ=+1
J≥K
K
K
J
x
Details
Details
In this Demonstration, ground state constants and quantum numbers are denoted by a double prime (″) superscript and excited state constants and quantum numbers are denoted by a prime (′) superscript.
The mathematical expressions for simulating the spectrum assume that the centrifugal distortion constants ,,and, and the anharmonicity constant, are negligible. The interaction of rotation and vibration is taken into account since the ground and excited state values for the rotational constants and are not equal (≠ and ≠). However, only a small difference between the ground and excited state values for these constants are used to simulate the spectrum, with =5.25, =0.85, and , . The spectrum is simulated at a temperature of 30 Kelvin.
Δ
J
Δ
JK
Δ
K
ω
e
χ
e
A
B
″
A
′
A
″
B
′
B
″
A
-1
cm
″
B
-1
cm
|ΔA|=0.07
-1
cm
|ΔB|=0.01
-1
cm
The spectral line corresponding to the chosen transition of interest is indicated by an arrow and labeled by (Z), with , , , and as follows.
W
X
Y
W
X
Y
Z
W
ΔK=0
Q
X
P
Q
R
Y
″
K
Z
″
J
For example, (3) indicates the line corresponding to the =4←=3 transition in the branch within the =1←=1 sub-band.
Q
R
1
′
J
″
J
R
′
K
″
K
Snapshots 1, 2, 3, and 4: full spectrum, branch, branch, branch views, respectively. The text indicates which sub-band is highlighted and describes the energy levels associated with the chosen transition. The spectral line corresponding to the chosen transition is indicated by an arrow and labeled with the proper transition nomenclature described in this section.
P
Q
R
Snapshot 5: with increasing , a decreasing number of lines are observed in the beginning of each branch of a sub-band. For example, in the branch within the sub-band, there are no transitions from =0,1,2 due to the restriction that .
K
R
K=3
″
J
J≥K
References
References
[1] P. Atkins and J. de Paula, Physical Chemistry, New York: Oxford University Press, 2006.
[2] G. Herzberg, Molecular Spectra and Molecular Structure II. Infrared and Raman Spectra of Polyatomic Molecules, Princeton, NJ: D. Van Nostrand Company, Inc., 1945.
External Links
External Links
Permanent Citation
Permanent Citation
Whitney R. Hess, Lisa M. Goss
"Rovibronic Spectrum of a Parallel Band of a Symmetric Rotor"
http://demonstrations.wolfram.com/RovibronicSpectrumOfAParallelBandOfASymmetricRotor/
Wolfram Demonstrations Project
Published: January 1, 1999