Modeling With Differential Equations
Modeling With Differential Equations
Based on the online module I attended from the University of Delft via EDx
We pretend that we grow rainbowfish to sell in pet stores.
The question is, how fast does the population grow?
We start to breed rainbowfish in a big nice aquarium .
We start with 30 fish, half of them male, half of them female. So our initial condition is
P(0)30.
Assumethatarainbowfishlivesnaturallyforapproximately1000days.Theagesofthefishinaquariumaremixed.Thedeathrateisdeathsperdayandthebirthrateisgivebirthsperday
d
1
1000
b0.7
The balance equation is given by the formula
ΔP(b-d)P(t)Δt
and 0.7P(t) describes how the population changes.
dP
dt
(*definethedifferentialequation*)
In[]:=
eqn={P'[t]==0.7*P[t]}
Out[]=
{[t]0.7P[t]}
′
P
(*definetheinitialcondition*)
In[]:=
cond={P[0]==30}
Out[]=
{P[0]30}
(*solvetheproblemwiththecommandDSolve*)
In[]:=
sol=DSolve[{eqn,cond},P[t],t]
Out[]=
{{P[t]30.}}
0.7t
Does this solution represent a realistic solution to our problem?
In[]:=
Plot[P[t]/.sol,{t,0,10},AxesLabel->{"Time (days)","Population"},PlotLabel->"Rainbowfish Population Over Time"]
Out[]=
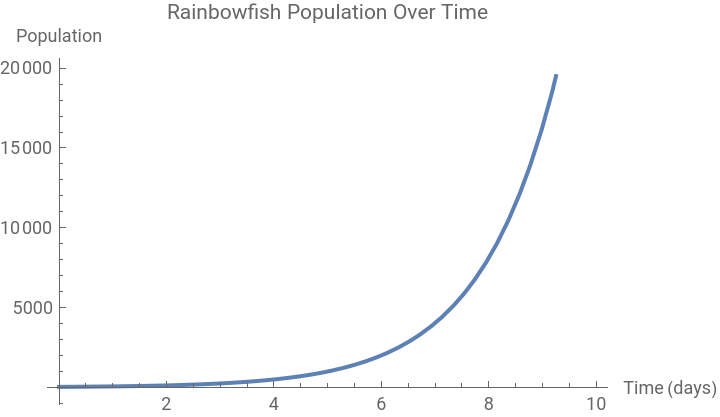
It is not realistic . Because after of a period of time we will have overpopulation of rainbow fish
First case
In[]:=
Clear["Global`*"]
◼
In this section we will add one sentence to our problem, in hope that this will limit the growth
“The aquarium owner expects to sell 20 rainbowfish everyday”
Now, 20 fish per day are sold so the balance equation becomes
ΔP0.7P(t)Δt-20Δt
If we use the above equation, our differential equation will become
′
P
In[]:=
eqn={P'[t]==0.7*P[t]-20}
Out[]=
{[t]-20+0.7P[t]}
′
P
In[]:=
cond={P[0]==30}
Out[]=
{P[0]30}
In[]:=
sol=DSolve[{eqn,cond},P[t],t]
Out[]=
{{P[t]1.42857(20.+1.)}}
0.7t
In[]:=
Plot[P[t]/.sol,{t,0,10},AxesLabel->{"Time (days)","Population"},PlotLabel->"Rainbowfish Population Over Time"]
Out[]=
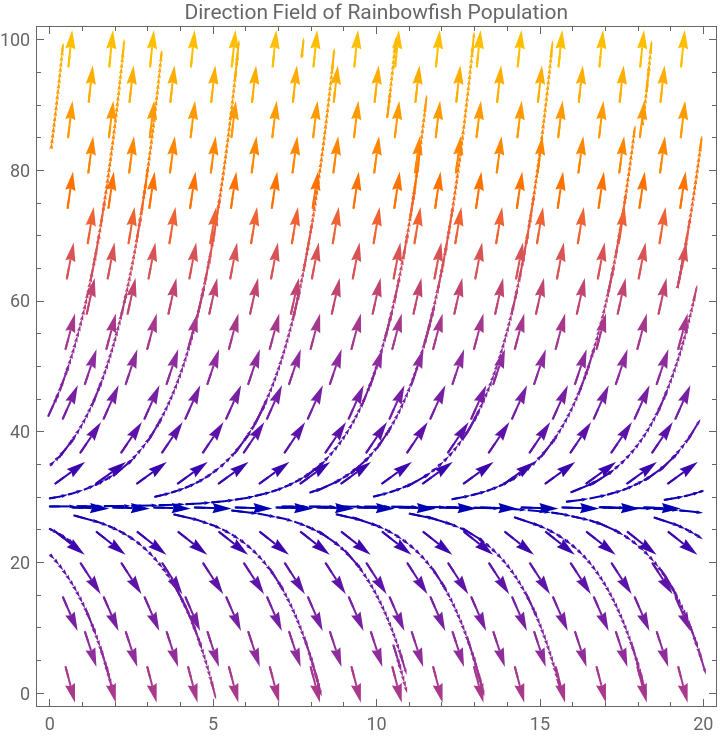
How you can construct the direction field of our differential equation and how you can sketch solutions to the differential equation if you know the initial condition
If we calculate the rates of change for many population sizes P and different times t, we can sketch the direction field.
In[]:=
VectorPlot[{1,0.7y-20},{x,0,20},{y,0,100},Axes->True,AxesLabel->{"Time (days)","Population"},StreamPoints->Fine,StreamScale->Small,PlotLabel->"Direction Field of Rainbowfish Population"]
Out[]=
Now we plot the direction field for
P(0)10,P(0)20,P(0)30,P(0)40,P(0)50,P(0)60
In[]:=
initialConditions={10,20,30,40,50,60};Show[VectorPlot[{1,0.7y-20},{x,0,20},{y,0,70},Axes->True,AxesLabel->{"Time (days)","Population"}],Plot[Evaluate[Table[NDSolveValue[{P'[t]==0.7P[t]-20,P[0]==ic},P[t],{t,0,20}],{ic,initialConditions}]],{t,0,20},PlotLegends->initialConditions,PlotStyle->Thickness[0.005]]]
Out[]=
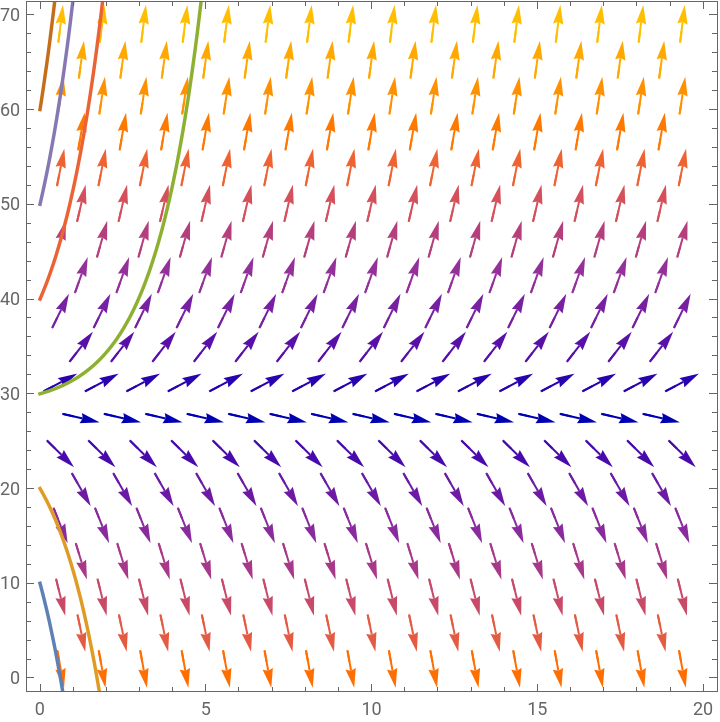


The equilibrium solution of a differential equation is a constant solution where the derivative is zero . For the given differential equation[t]0.7P[t]-20we can find the equilibrium solution by setting the derivative equal to zero and solving for \(P\) :So the equilibrium solution isThis equilibrium solution represents a constant population level at which the birth rate and death rate are balanced, and the population neither grows nor declines .
′
P
00.7P-200.7P20\[NewLine]P≈28.5714
20
0.7
P≈28.5714
Here the equilibrium point is 20/0.7
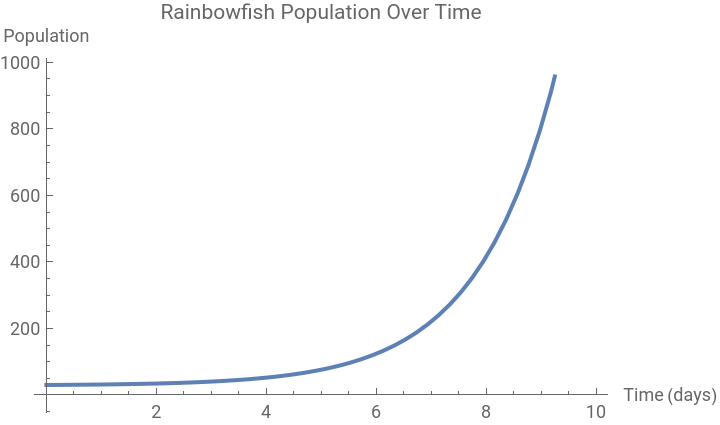
The solutions are not realistic, because if you start with 30 rainbowfish, the population grows within four days to more than a sixty rainbowfish . This number keeps increasing, which means at some time the aquarium will be really full (and might even break)
Second case
◼
In this section, we will incorporate the limited capacity of the aquarium. When an aquarium gets crowded, the fish lay fewer eggs, fewer young fish survive and the fish may die earlier, so the growth of the population slows down.
The problem statement is now :
An aquarium owner is breeding a population of rainbowfish . He starts with 30 rainbowfish and expects to sell 20 rainbowfish every day . The aquarium is large enough for a healthy population of 750. Predict the development of the size of the population .
An aquarium owner is breeding a population of rainbowfish . He starts with 30 rainbowfish and expects to sell 20 rainbowfish every day . The aquarium is large enough for a healthy population of 750. Predict the development of the size of the population .
So the mathematical model has to be improved to be more realistic
So the differential equation becomes
From the direction Field we can observe that 720.248 is stable and 29.7516 is unstable.
Improving the model
Now we want to know how long it takes to breed them . Do you have to invest years to grow a good - sized population, or can it be done in a few weeks?
We will focus on answering the following question :
How long does it take for the rainbowfish population to get into its equilibrium state?
How long does it take for the rainbowfish population to get into its equilibrium state?
How long does it take to reach that equilibrium?
Mathematically, the answer is : "infinitely long"
Mathematically, the answer is : "infinitely long"
A possible solution is shown below .
It is much more difficult to guess how long the beginning and the end phases take .
The Euler’s Method
The Euler’s Method
As we can see both ways are quite accurate . However what I haven' t understood is why in the Euler Method the dotted line stops and continues perpendicular to the x-axis?