WOLFRAM NOTEBOOK

Lab 2: Wi Fi and Cellular

NetID: <Please fill in>
Link to published notebook: <You have to publish first to get the link, then add it here, and then print as PDF to submit to Gradescope>

Part 1: Attenuation

In this part, we will visualize the signal of our message, and see how a received signal changes when with distance from the transmitter.

Visualize a signal

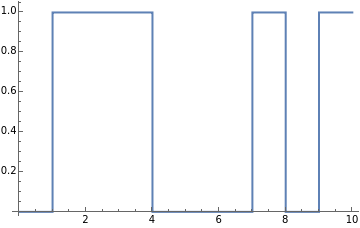
Let's start with plotting your favorite binary message (containing only ten bits).
Specify the bits:
In[]:=
bits={0,1,1,1,0,0,0,1,0,1}
Out[]=
{0,1,1,1,0,0,0,1,0,1}
Plot the signal:
In[]:=
ListStepPlot[bits,Left]
Out[]=

Visualize the location of a device and strength of received signal

Let's say we have a router WiFi router that needs to send a signal and a phone that needs to receive it.
Specify the bits, location of the router and location of the phone:
In[]:=
newBits={1,0,0,1,1,0,1,0,1,1};(*ForlocationswewillusetheCartesianco-ordinatesystemandprovidexandyvalues*)routerLocation={0.,0.};phoneLocation={2.,0.};
Visualize the location of the phone with respect to the router:
ListPlot{{routerLocation},{phoneLocation}},AxesNone,FrameTrue,PlotRange{{-1,phoneLocation1-routerLocation1+1},Automatic},PlotMarkersImageResizeImageCrop
,60,ImageResize
,30,GridLinesAutomatic,PlotLabel"Location of device w.r.t. router"
Out[]=
Calculate the distance between the router and the phone (r):
In[]:=
r=EuclideanDistance[routerLocation,phoneLocation]
Remember signal strength reduces according to the formula
s
2
r
So if we know the transmitted signal strength, we can compute the received signal strength.
Compute the received signal strength (rs) for s=10:
In[]:=
s=10;rs=s/r^2
Visualize the transmitted signal at the router and the received signal at the phone together:
In[]:=
ListStepPlot{newBits*s,newBits*s/EuclideanDistance[routerLocation,phoneLocation]^2},
Change the location of the phone (
phoneLocation
) to move the phone to a different location and re-compute r and received signal strength. Re-evaluate the following code to see how the signal strength changes.
In[]:=
newBits={1,0,0,1,1,0,1,0,1,1};routerLocation={0.,0.};phoneLocation={1.,-2.};s=10;ListStepPlot{newBits*s,newBits*s/EuclideanDistance[routerLocation,phoneLocation]^2},

Part 2: Noise

Add noise to the signal

In the real world, the received signal will contain noise. Let’s add some noise to our plots as well as signal attenuation due to distance.
Again, specify bits and create a signal out of the bits:
In[]:=
signalBits={1,0,0,1,1,0,1,0,1,1};signal=Flatten[signalBits*ConstantArray[1,{10,25}]];
Generate some random noise:
In[]:=
noise=RandomReal[{0,.15},10*25];
Visualize the signal by itself as well as when combined with noise:
In[]:=
ListPlot[{noise+signal,signal},Joined->True,PlotLegends->{"Signal + Noise","Signal"}]
Set the distance between router and device:
In[]:=
r=1.;
Compute the strength of the attenuated at distance r:
In[]:=
attSignal=signal/r^2;
Compute the actual received signal with the effects of attenuation and noise combined:
In[]:=
receivedSignal=attSignal+noise;
Visualize the transmitted signal along with the received signal:
In[]:=
ListPlot{receivedSignal,signal},

Problem 1

Can you still decode the signal manually?
Try changing the distance (r) and report at what distance does the signal start to get corrupted?

Answer:


Making the computer decode the signal

Now, let’s see if a computer can decode the signal. We will average the signal received for the time of transmission of one bit, and then plot this averaged signal.
Compute the average signal from the noisy signal:
In[]:=
averagedReceivedSignal=Flatten[Mean/@Partition[receivedSignal,25]*ConstantArray[1,{10,25}]];ListLinePlot{receivedSignal,averagedReceivedSignal},
Set a threshold for decoding signals and use it to get zeros and ones from the averaged signal (so that anything greater than a threshold value is decoded as 1 and anything below it is a 0):
In[]:=
threshold=0.12;decodedSignal=averagedReceivedSignal/.{x_/;x>threshold->1,y_/;y<=threshold->0};
Visualize transmitted signal, noisy signal and decoded signal:
ListPlot{signal,(*signaltransmitted*)receivedSignal,(*signalreceived*)averagedReceivedSignal,(*signalaveragedduringdurationofabit*)decodedSignal(*signaldecodedbycomparingaverageagainstathreshold*)},

Problem 2

Using this averaging technique, do you think a computer will be able to decode the signal?

Answer


Problem 3

Evaluate the following code code to answer the questions:
  • What is the decoded signal?
  • What is the maximum distance of your device from the transmitter (router or cell tower) for which the decoding works?
  • How would you change the threshold for decoding the signal as 1s and 0s?
  • How would you change the strength of the signal you are transmitting?
  • Answer

    Part 3: Interference

    Visualize interfering signals

    Next, we will observe the effect of interference on the received signal.
    Set the location of your WiFi router (blue) that is transmitting your favorite binary signal to your device .
    There are also two neighboring WiFi routers (neighbor1 in green and neighbor2 in red) that are transmitting, causing interference . Set the signals and locations for each router.
    Set the signal strength (all three routers are transmitting at same strength):
    Finally, set the location of your device located at a specific point with respect to the 3 routers:
    Evaluate the code below to see the location of the phone w.r.t. the routers and the signals received at the device:

    Problem 4:

    Try changing the location of the device and see how the signal graphs change.
    Enter a coordinate (x, y) for the device such that the neighbor's signal becomes stronger than the signal from your own router. You can also adjust the strength of the transmitted signal.

    Report the location of your device and the strength of the transmitted signal.

    Answer


    Part 4: The Big Picture

    Calculate SINR

    Set the signal strength, noise strength and interference strength:
    Compute the SINR:

    Visualize SINR around the router

    But remember we have to adjust the strength of both the real signal from your router and the interference from the neighbors according to the distance from the routers!!!
    Set locations of your router and your neighbors’ routers as before:
    The following visualization shows the SINR for the signal received from your router in the area surrounding your router:

    Problem 5

    Try moving your router and the neighbors’ routers to see how the coverage area changes.
    Make it so that the coverage area becomes a very non-circular blob, and save your notebook with that configuration.

    Answer

    Submitting your work

    1
    .
    Publish your notebook
    1
    .
    1
    .
    From the cloud notebook, click on “Publish” at the top right corner.
    1
    .
    2
    .
    From the desktop notebook, use the menu option File -> Publish to Cloud
    2
    .
    Copy the published link
    3
    .
    Add it to the top of the notebook, below your netID
    4
    .
    Print to PDF
    5
    .
    Upload to Gradescope
    6
    .
    Just to be sure, maybe ping your TA Sattwik on Slack that you have submitted.
    Wolfram Cloud

    You are using a browser not supported by the Wolfram Cloud

    Supported browsers include recent versions of Chrome, Edge, Firefox and Safari.


    I understand and wish to continue anyway »
    You are using a browser not supported by the Wolfram Cloud. Supported browsers include recent versions of Chrome, Edge, Firefox and Safari.