Working with Data
Working with Data
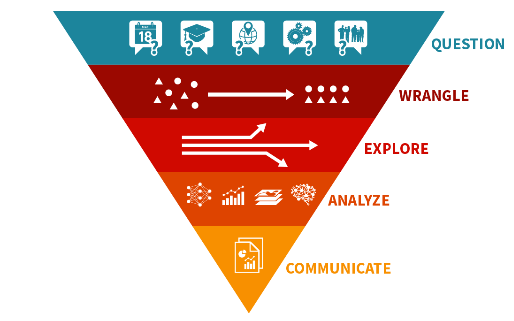
A Simple Data Science Workflow
A Simple Data Science Workflow
Any data science project benefits from a flexible, modular, iterative and multiparadigm workflow.
Setting up Questions
Setting up Questions
The first stage of the workflow is where you frame questions. To get some useful conclusions from the data, you need to start out with the right questions.
What Can You Learn from the Data?
What Can You Learn from the Data?
That is a pretty broad question. It makes sense to break it down into a few specific questions that can guide your analysis.
Topic-specific questions like:
◼
How many…?
◼
Who…?
◼
Where…?
◼
What happened, together with…?
Generic questions like:
◼
Who is this analysis for?
◼
What is the action that will be driven by the insight from this analysis?
◼
How will they access the results? At what frequency?
The questions can be fuzzy as you start out, and they can change later. In fact, more interesting questions may surface as you sift through the data. However, it is important to set up questions at the beginning with the audience in mind. Otherwise, with the sheer variety of things that you can try with the data, you might end up wasting a lot of time trying unnecessary things.
Data Wrangling
Data Wrangling
◼
Process of importing raw data and converting it into a suitable format for downstream analysis
◼
Sometimes requires “hacking skills” to organize and clean messy data into an informative, manageable dataset
◼
Goal is to create code for semi-automated tools that would make the process easier the next time the workflow is used
Exploratory Data Analysis
Exploratory Data Analysis
Exploratory data analysis (EDA) can help:
◼
Gain an intuitive understanding of the underlying nature of the dataset
◼
Identify relationships between variables
◼
Formulate good questions for the actual analysis (as the explorations proceed, those questions can change)
◼
Evaluate the quality of the data (Data QA)
Tools used in EDA can be categorized as:
◼
Graphical or non-graphical
◼
Univariate (exploring one feature/variable at a time) or multivariate (exploring combined behavior of more than one variable)
Analyzing Data: Machine Learning can Help
Analyzing Data: Machine Learning can Help
Questions that can be answered by supervised machine learning:
◼
Classification: Is this A or B? (Is this A or B or C or D…?)
◼
Regression: How many or how much?
Questions that can be answered by unsupervised machine learning:
◼
Clustering: How is the data organized? Does the data have some inherent structure? Do the samples sort themselves out into different groups and subgroups?
◼
Anomaly detection: Is this unusual? Are there outliers in the data?
◼
Sequence Prediction; Time Series Forecasting: What comes next?
Communicating Results
Communicating Results
◼
Visualizations and infographics
◼
Computational essays or reports
◼
Web deployed apps or microsites