Quick Foundation: Vector Spaces
Quick Foundation: Vector Spaces
Visualizing entities as points (represented by a list of numbers) in vector spaces
Single numbers (1D)
Single numbers (1D)
Simple case
Simple case
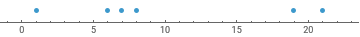
Which numbers are closer to each other?
{1,6,8,19,7,21}
Let’s visualize them:
In[]:=
NumberLinePlot[{1,6,8,19,7,21}]
Out[]=
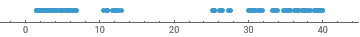
Let’s make it a little more complex ...
Let’s make it a little more complex ...
Which numbers are closer to each other?
In[]:=
numbers=
Out[]=
{2.91748,2.58475,38.8779,5.17159,35.4639,3.43902,12.8865,3.17415,30.7232,39.9808,39.5754,39.9336,3.13157,30.8344,5.904,2.96346,11.664,12.5453,36.7531,1.96803,12.0256,30.4299,5.15041,35.1926,33.2336,26.1885,27.2861,38.9637,36.3474,30.998,5.02725,36.4645,33.9447,39.7156,4.13711,37.2297,3.21325,35.4052,1.43734,10.9651,39.1853,12.2656,5.08272,36.2018,6.5651,6.61242,5.47358,37.2553,37.6554,35.002,4.90866,1.43139,35.7345,1.93139,26.3202,2.03956,2.64124,5.18829,38.4046,25.4629,30.1716,4.52939,25.4593,1.76716,5.09945,11.0365,25.325,26.545,5.72179,3.81483,6.53859,5.9974,38.1264,39.8559,6.94288,37.4593,3.37336,35.4115,4.87247,5.50739,33.561,11.1144,35.4453,30.2812,34.7469,27.5489,1.65906,2.58109,5.87168,37.6435,25.1506,6.5075,3.54959,31.3157,4.17196,2.33679,39.7293,6.00207,3.92181,33.6116,30.0097,36.6941,5.1776,30.5534,30.3552,39.353,31.4886,3.22308,12.2009,31.4406,3.46052,36.6111,6.55127,26.4293,10.5189,5.09798,39.3293,5.0461,31.9048,37.6677}
In[]:=
numbers//Column
Out[]=
2.91748 |
2.58475 |
38.8779 |
5.17159 |
35.4639 |
3.43902 |
12.8865 |
3.17415 |
30.7232 |
39.9808 |
39.5754 |
39.9336 |
3.13157 |
30.8344 |
5.904 |
2.96346 |
11.664 |
12.5453 |
36.7531 |
1.96803 |
12.0256 |
30.4299 |
5.15041 |
35.1926 |
33.2336 |
26.1885 |
27.2861 |
38.9637 |
36.3474 |
30.998 |
5.02725 |
36.4645 |
33.9447 |
39.7156 |
4.13711 |
37.2297 |
3.21325 |
35.4052 |
1.43734 |
10.9651 |
39.1853 |
12.2656 |
5.08272 |
36.2018 |
6.5651 |
6.61242 |
5.47358 |
37.2553 |
37.6554 |
35.002 |
4.90866 |
1.43139 |
35.7345 |
1.93139 |
26.3202 |
2.03956 |
2.64124 |
5.18829 |
38.4046 |
25.4629 |
30.1716 |
4.52939 |
25.4593 |
1.76716 |
5.09945 |
11.0365 |
25.325 |
26.545 |
5.72179 |
3.81483 |
6.53859 |
5.9974 |
38.1264 |
39.8559 |
6.94288 |
37.4593 |
3.37336 |
35.4115 |
4.87247 |
5.50739 |
33.561 |
11.1144 |
35.4453 |
30.2812 |
34.7469 |
27.5489 |
1.65906 |
2.58109 |
5.87168 |
37.6435 |
25.1506 |
6.5075 |
3.54959 |
31.3157 |
4.17196 |
2.33679 |
39.7293 |
6.00207 |
3.92181 |
33.6116 |
30.0097 |
36.6941 |
5.1776 |
30.5534 |
30.3552 |
39.353 |
31.4886 |
3.22308 |
12.2009 |
31.4406 |
3.46052 |
36.6111 |
6.55127 |
26.4293 |
10.5189 |
5.09798 |
39.3293 |
5.0461 |
31.9048 |
37.6677 |
Visualization helps:
In[]:=
NumberLinePlot[numbers]
Out[]=
Distance of one entity from another ...
Distance of one entity from another ...
Out[]=
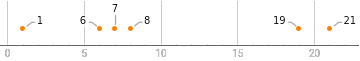
What is the distance from one number to another?
In[]:=
EuclideanDistance[19,21]
Out[]=
2
In[]:=
EuclideanDistance[1,21]
Out[]=
20
Which number is further away from 21?
Pairs of numbers (2D)
Pairs of numbers (2D)
Simple example
Simple example
Let’s move to 2 dimensions.
Say something is represented by 2 numbers. Here are 4 such things:
Say something is represented by 2 numbers. Here are 4 such things:
How far are they from each other?
Can you think of something represented by 2 numbers?
Can you think of something represented by 2 numbers?
Geographic coordinates: Latitude and Longitude
Geographic coordinates: Latitude and Longitude
Similar idea as the first example with pairs of numbers
Similar idea as the first example with pairs of numbers
What problem can we solve with such numbers?
What problem can we solve with such numbers?
Triplets (3D)
Triplets (3D)
Simple example
Simple example
Let’s move to 3 dimensions.
Say something is represented by 3 numbers. Here are 10 such things:
Say something is represented by 3 numbers. Here are 10 such things:
How far are they from each other?
A single point
A single point
Can you think of something represented by 3 numbers?
Can you think of something represented by 3 numbers?
What about digital representation of colors?
100 colors
100 colors
N Dimensions
N Dimensions
Movies in 3 dimensional feature space
Movies in 3 dimensional feature space
If we were to represent movies in 3 dimensions (just like the colors) ...
Instead of Red, Green and Blue,
say we somehow measure genre of the content: Comedy, Sci Fi, Action
Instead of Red, Green and Blue,
say we somehow measure genre of the content: Comedy, Sci Fi, Action
Movies in n-dimensional feature space
Movies in n-dimensional feature space
Instead of three, choose as many dimensions as you want.
◼
Comedy,
◼
Tragedy,
◼
Informative,
◼
Action,
◼
SciFi,
◼
Romance,
◼
Historic,
◼
Apocalyptic, .....
◼
Strong Female Protagonist, .....
◼
Year in which it was created,
◼
Won an Oscar,
People who watched and rated the movies in Feature Space
People who watched and rated the movies in Feature Space