ABSTRACT: The aviation industry, especially in Europe, is moving toward electrification to meet Net Zero CO2 goals by 2050. This thesis explores the range and economic viability of three sustainable regional aircraft concepts for Swedish domestic flights in 2030 and 2040. It evaluates three existing models : the fully electric Eviation Alice, EL19, and the hybrid - electric version of the Dornier 328. Using technology forecasting estimations, by 2030 these aircraft will have a range of up to 206 to 450 km, with potential to cover all of Scandinavia by 2040. Cost assessments show that while electric aircraft could cover key routes by 2040, acquisition and operating costs remain a challenge . Additionally, a Modelica - based hybrid - electric propulsion model was developed to simulate engine and motor performance and emissions . This study underscores the need for realistic technology forecasting and cost management to make sustainable aircraft commercially viable, offering strategies to mitigate cost gaps . CITATION (original thesis): Erick Espinosa Juárez, 2024, A Model-Based Systems Engineering Exploration of Three Sustainable Regional Aircraft Concepts, Linköping universitet. https://www.researchgate.net/publication/383532166_A_Model-Based_Systems_Engineering_Exploration_of_Three_Sustainable_Regional_Aircraft_Concepts
Disclaimer: I am a user with no specialization in Computer Science (which means coding has never been my forte). My code is most often far from being elegant, but at least it works. Wolfram’s GPT in ChatGPT helped a lot with the smaller details.
Literature Review
Review on Regional Aviation
Review on Regional Aviation
Equivalent CO2 emissions as a function of flight distance
Equivalent CO2 emissions as a function of flight distance
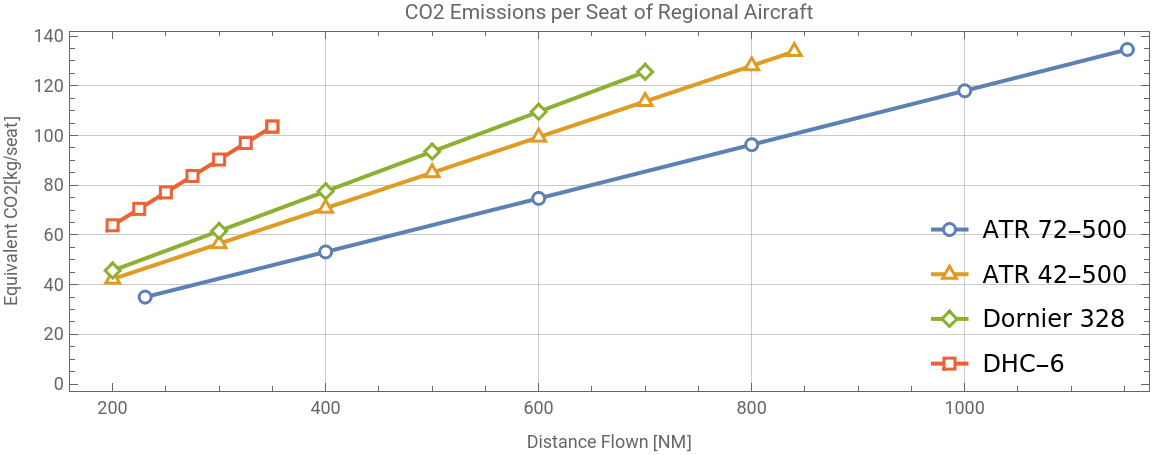
The Aeronautical Modeling software Pacelab can export data relating fuel burned as a function of the distance flown for a set of conventional regional airplanes. Knowing that 1 kg of fuel produces 3.16 kg of fuel, the equivalent CO2 (carbon dioxide produced per seat) can be plotted. The graph reveals that, counterintuitively, the smaller the aircraft the higher the equivalent CO2 produced . While the net CO2 produced by the smaller aircraft is less than for the bigger ones, it also gets distributed between a smaller number of passengers. The different lengths show the different ranges the aircraft can attain.
Data from Pacelab software in the shape of: {NM,kg of fuel}
atr42500=;atr72500=;do328=;dhc6=;
Declared Passenger Capacity
atr42PAX=48;atr72PAX=68;do328PAX=32;dhc6PAX=19;
Multiplied block fuel by 3.16 (since 1kg of fuel produces 3.16 kg of CO2) and divided by passenger capacity
atr42500Modified = Map[{#[[1]], 3.16 * #[[2]] / atr42PAX} &, atr42500];atr72500Modified = Map[{#[[1]], 3.16 * #[[2]] / atr72PAX} &, atr72500];do328Modified = Map[{#[[1]], 3.16 * #[[2]] / do328PAX} &, do328];dhc6Modified=Map[{#[[1]], 3.16 * #[[2]] / dhc6PAX} &, dhc6];
Plotting
p=ListLinePlot[{atr72500Modified, atr42500Modified, do328Modified, dhc6Modified}, FrameLabel -> {"Distance Flown [NM]", "Equivalent CO2[kg/seat]"}, PlotLabel -> "CO2 Emissions per Seat of Regional Aircraft",Frame -> True, GridLines->Automatic, PlotMarkers->"OpenMarkers", AspectRatio->1/3, PlotLegends -> Placed[{"ATR 72-500", "ATR 42-500", "Dornier 328", "DHC-6"},{Right,Bottom}], ImageSize->Large]
Out[]=
Correlation between Aircraft Operations and NOx concentration
Correlation between Aircraft Operations and NOx concentration
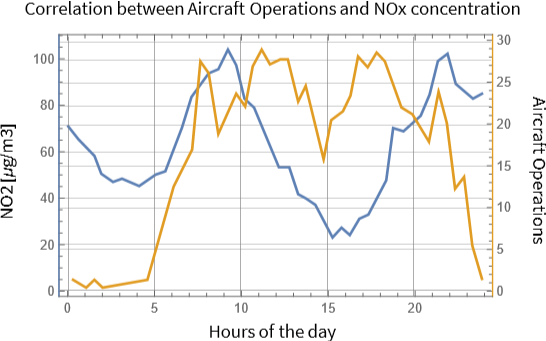
Using the data retrieved in E . Fleuti Effects of Covid - 19 - Related Air Traffic Restrictions on Local Air Quality at Zurich Airport (2020), a multiaxis list line plot showing NOx presence in an airport (orange line) and the number of operations (blue) show that the two phenomena are correlated by having similar shapes.
DATA
Hours vs. NOx
Hours vs. NOx
NOx=;
Hours vs . number of operations
operations=;
Plotting
plot = ListLinePlot[{NOx,operations}, Frame -> True, GridLines -> Automatic, MultiaxisArrangement -> All]; Labeled[plot,{Rotate["NO2 [μg/m3]",Pi/2],"Hours of the day",Rotate["Aircraft Operations",-Pi/2],"Correlation between Aircraft Operations and NOx concentration"},{Left,Bottom,Right,Top}]
Out[]=
Replacement of Current Regional Aircraft Market Prediction.
Replacement of Current Regional Aircraft Market Prediction.
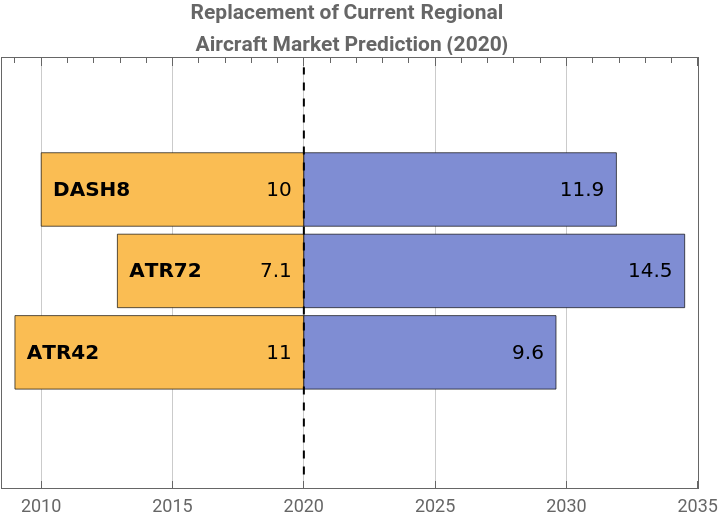
The following chart shows bars spanning from a fixed date to both past and present. It shows the forecasted replacement of three regional aircraft: DASH8, ATR72 and ATR42. Using the 2020’s average age of the aircraft (orange bar) and its expected useful life, one can infer its time until retirement (blue bar) and an estimate of the year that it will take place. It uses data from IATA’s Decomissioning Report (2018) and ATR’s Market Forecast (2022).
Out[]=


Forecast on Technology Adoption on Civil Aviation
Forecast on Technology Adoption on Civil Aviation
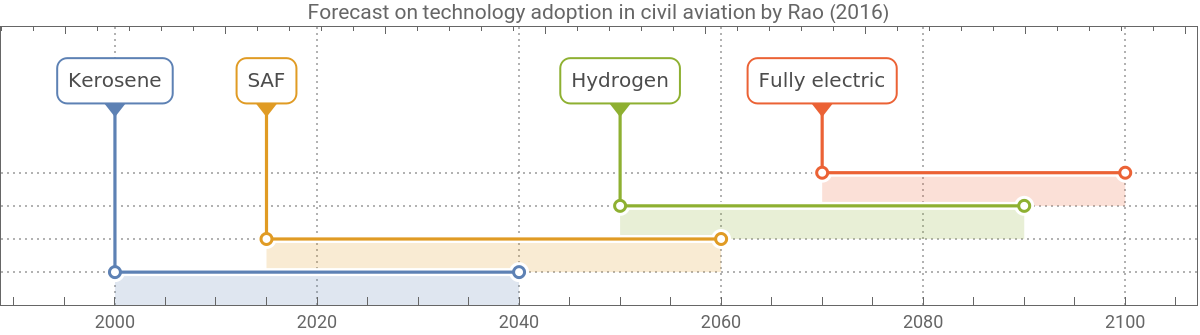
This TimeLinePlot shows the prediction made in Rao (2016) of the timeframes when certain technologies will become the main means of propulsion of a civil aviation aircraft. It is interesting to see that the fully electrified flight is expected to happen after hydrogen has been adopted.
Out[]=
Batteries and Thermal Management
Batteries and Thermal Management
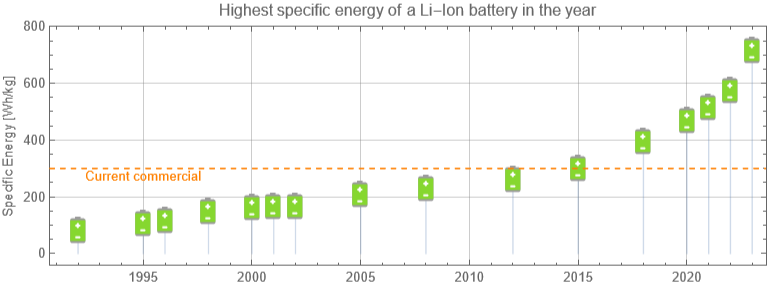
Evolution of highest specific energy on Li-ion batteries.
Evolution of highest specific energy on Li-ion batteries.
This ListPlot shows the highest reported battery specific energy. That is, how much energy a battery can store by unit of mass in [Wh/kg] units. While it shows a steeper increase since 2015 (attributable in part to the automotive industry investment on battery research), the orange dashed line shows that there is a large difference between what has been reported to work on lab conditions in 2023 to what is currently commercially available.
Out[]=
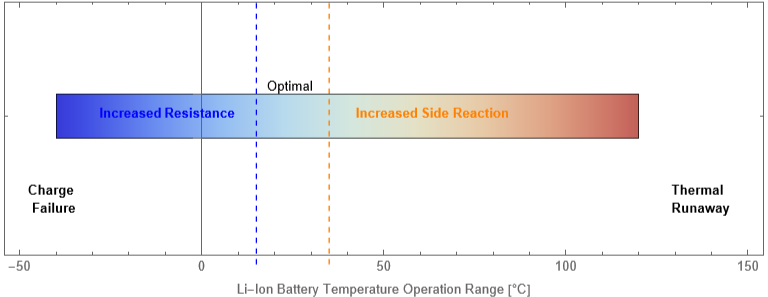
Li-Ion Battery Temperature Operation Range
Li-Ion Battery Temperature Operation Range
This BarChart shows the current Li-Ion operating temperature range (range between dashed lines), the consequences of reaching higher or lower temperatures (bold black text) and the effect of higher temperature on the battery’s chemistry (blue and orange text).
Out[]=
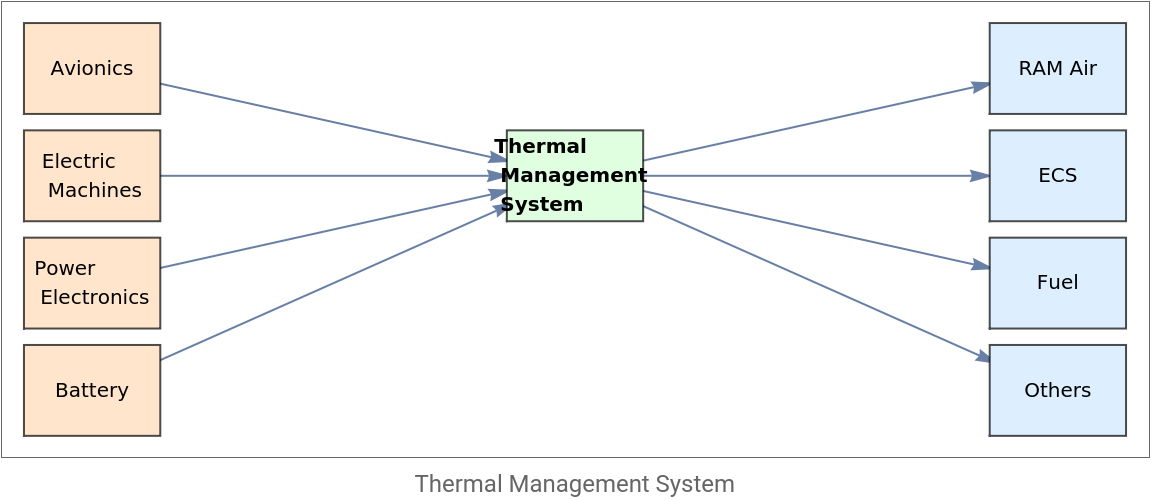
Conceptual Operation of a Thermal Management System
Conceptual Operation of a Thermal Management System
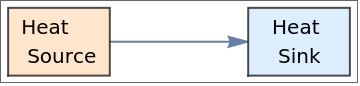
This graph shows the heat sources in an aircraft (where heat is produced, in light red) and the heat sinks (where heat is dissipated, in light blue). These types of diagrams are widely used in systems engineering to outline the objectives of a thermal management system, even when specific details are not yet known.
Out[]=
,
RadarChart on Thermal Management Systems Qualitative Properties.
RadarChart on Thermal Management Systems Qualitative Properties.
This radar chart qualitatively compares the properties of the three main types of thermal management (a.k.a. cooling systems) used in batteries. While systems based on phase-changing materials are the most efficient in terms of cooling (with excellent temperature distribution and thermal conductivity), the air cooling’s low weight is one if not the most desirable characteristic in an aeronautical system.
Electric Motors
Electric Motors
NumberLinePlot on Electric Motor Power Related to the Size of the Aircraft Powered
NumberLinePlot on Electric Motor Power Related to the Size of the Aircraft Powered
This NumberLinePlot chart shows the range of power required by an electric motor to give propulsion to a determinate size of aircraft. The 1 MW milestone (red dashed line) is defined as such because it is expected to be able to propel aircraft ranging from 9 to 150 passengers. The large ranges of power of bigger aircraft are due to the fact that numerous less powerful motors can be used as a form of distributed propulsion (left end of the ranges) or instead use fewer more powerful motors (right end of the ranges).
Current electric motor specific power
Current electric motor specific power
From the last graph, people familiarized with electric motors may argue that >1 MW electric motors already exist. When it comes to aeronautical applications, it’s not just a question of power, but also of weight. This graph shows the ranges of specific power (in units of power divided by mass) currently reported on electric motors. In purple (right, top), one can see that the 1 MW objective is still far from even the most modern motors operating in laboratory conditions (red). Data from J. L. Felder Overview of electrified aircraft propulsion at NASA (2019) was used.
Results
Curve characterizations
Curve characterizations
MagniX Electric Motor Mathematical Characterization
MagniX Electric Motor Mathematical Characterization
The electric motor manufacturer MagniX provided an efficiency map upon request. This efficiency map relates the torque produced (q) to the rotational speed (ω) at various efficiencies. Shaping values of equations modeling this behaviour were tuned using sliders (figure) to match the efficiency map provided. Afterwards, these tuned equations were used in Wolfram System Modeler as a “blackbox” component.
Battery technology forecast
Battery technology forecast
The forecast is a slight modification from the one developed for electric motor specific power projections in Pastra et al. (2022). These authors propose approximating the technology evolution through the use of a logistic function, shown (with a slight modification of the original) in the following equation:
Logistic functions are S-shaped functions commonly used to model quantities that grow fast (the case of accelerated technology development) and then slow down once they reach their upper limit (when technology starts reaching its theoretical limit, for example).
The battery specific energy historical data (previously plotted alone) is added as a background with battery emojis markers and an orange line. The delay between “reported in the lab” until “certified for aeronautical usage” displaces the original line to the right through the “Delay” slider (shown as the blue filled line). The parameters of the logistic function (in dashed red) are then adjusted manually through the use of sliders to resemble the shape of this displaced battery evolution line. MIT and Boeing’s predictions are shown as green and blue dots for reference.
The battery specific energy historical data (previously plotted alone) is added as a background with battery emojis markers and an orange line. The delay between “reported in the lab” until “certified for aeronautical usage” displaces the original line to the right through the “Delay” slider (shown as the blue filled line). The parameters of the logistic function (in dashed red) are then adjusted manually through the use of sliders to resemble the shape of this displaced battery evolution line. MIT and Boeing’s predictions are shown as green and blue dots for reference.
According to Chin et al. from NASA (2021), the battery specific energy predicted by this method still needs to be further reduced by 26.66% to account the cell-to-pack level reduction. The final result using a 15 years delay was 260 Wh/kg for the 2030 scenario and 633 Wh/kg for 2040.
2030 Scenario Predictions
2030 Scenario Predictions
The previous technology forecast results were introduced as parameters to the three aircraft models developed in the Pacelab APD software. This models were simulated in relevant environments to obtain an estimate of the aircrafts’ expected ranges.
Aircraft Mission Profiles 2030
Aircraft Mission Profiles 2030
The following ListLinePlot shows the flight mission profiles (distance vs. altitude) of the three sustainable aircraft imported from the Pacelab APD software. The low cruising altitude of the EL19 is due to the fact that it has no pressurization system, limiting its flight to lower, oxygen rich atmospheric levels. Although the Alice can cruise at higher altitudes, it conserves its limited electric energy by minimizing time spent climbing, as this is a less efficient phase of flight.
Map of ranges 2030
Map of ranges 2030
For a graphic visualization of the previously discussed ranges in a Scandinavian context, a map showing the ranges of the Alice (red), Dornier (orange) and EL19 (blue) departing from Stockholm is shown on top of some of the most common Swedish domestic routes.
2040 Scenario Predictions
2040 Scenario Predictions
Aircraft Mission Profiles 2040
Aircraft Mission Profiles 2040
With a higher battery capacity prediction, these are the extended ranges expected for the same aircraft in 2040. The cruising altitudes reimain the same.
Map of ranges 2040
Map of ranges 2040
The same graphic visualization of the newer ranges of the Alice (red), Dornier (orange) and EL19 (blue) departing from Stockholm. is shown on top of some of the most common Swedish domestic routes. Orthographic projection was chosen.
Cost Analysis
Cost Analysis
Acquisition Cost Plotting
Acquisition Cost Plotting
The sustainable aircraft’s properties were saved in an association of associations. These properties, along with standard hourly rates, were used in a function of the Acquisition Cost Estimation Model developed by Finger et al. (2019) to obtain an estimate selling price for these three aircraft. The Consumer Price Index (CPI) was used to adjust for inflation since 2019. The result is shown on the following bar chart in units of millions of dollars.
Direct Operating Cost Analysis
Direct Operating Cost Analysis
Mission Calculation
Mission Calculation
Using functions of atmospheric properties and aircraft performance equations, an estimation of a given flight mission (from the depart to arrive variables) is obtained. The results are printed as an association of associations, along with a map of the route.
Direct Operating Cost (DOC) Estimation
Direct Operating Cost (DOC) Estimation
Operating an aircraft costs money, which is dependant on the acquisition cost previously derived. The mission result and the aircraft characteristics are introduced into the Direct Operating Cost model (also developed by Finger et al . (2019) and complimented with the AEA model). The results of the different DOC categories are shown in the following bar charts for the three aircraft. Some remarks are that the fuel and oil costs are only present in the Do328HE, since the other two aircraft are fully electric. The Alice also has zero cabin crew cost, since its 9 passengers do not require a stewardess by law.
Normalized Unit Costs
Normalized Unit Costs
Since airplanes are of different size, the cost must be normalized for fair comparison. The industry uses the so-called Unit Cost, which can be understood as the cost per seat per kilometer.
Therefore, dividing the total direct operating cost by the passenger capacity and the distance flow, yields the following costs:
CITE THIS NOTEBOOK
CITE THIS NOTEBOOK
A model-based systems engineering exploration of three sustainable regional aircraft concepts
by Erick Espinosa-Juárez
Wolfram Community, STAFF PICKS, October 22, 2024
https://community.wolfram.com/groups/-/m/t/3305095
by Erick Espinosa-Juárez
Wolfram Community, STAFF PICKS, October 22, 2024
https://community.wolfram.com/groups/-/m/t/3305095