ListContourPlot with RegionFunction
ListContourPlot with RegionFunction
Define some point data
Define some point data
Get a concave hull mesh
Get a concave hull mesh
Corresponding concave hull boundary mesh
Corresponding concave hull boundary mesh
Display contour plot
Display contour plot
What about contouring face-by-face?
What about contouring face-by-face?
Function for scaling BoxRatios
Function for scaling BoxRatios
3D mesh region
3D mesh region
Get list of all polygons that define the mesh
Get list of all polygons that define the mesh
Range of z coordinate values
Range of z coordinate values
In[]:=
zrange=pts//Map@Last//MinMax
Out[]=
{46.836,67.214}
Desired contour interval
Desired contour interval
In[]:=
cint=1;
Contour range
Contour range
In[]:=
contourRange={Floor[First@#,cint],Ceiling[Last@#,cint]}&[zrange]
Out[]=
{46,68}
In[]:=
contourRangeDifference=contourRange//Differences//First
Out[]=
22
Contour values
Contour values
In[]:=
contours=Range[Sequence@@contourRange,cint]
Out[]=
{46,47,48,49,50,51,52,53,54,55,56,57,58,59,60,61,62,63,64,65,66,67,68}
ListContourPlot for each mesh cell
ListContourPlot for each mesh cell
In[]:=
contouredCells=ParallelTableListContourPlotpolys[[i,1]],BoundaryStyle->{GrayLevel[0.9],Thickness@Small},
ColorFunction->ColorData["SolarColors"]&
#-First[contours]
contourRangeDifference
,
ColorFunctionScalingFalse
,
Contours->contours,ContourStyle->Directive[Black,Thickness@Medium],Frame->False,(*InterpolationOrder->1,*)Mesh->None,PlotLegends->None,PlotRange->contourRange,{i,Length@polys};Show first to All contoured mesh cells
Show first to All contoured mesh cells
In[]:=
Show[boundaryMesh,contouredCells,AspectRatio->Automatic,Frame->True,ImageSize->Large]
Out[]=
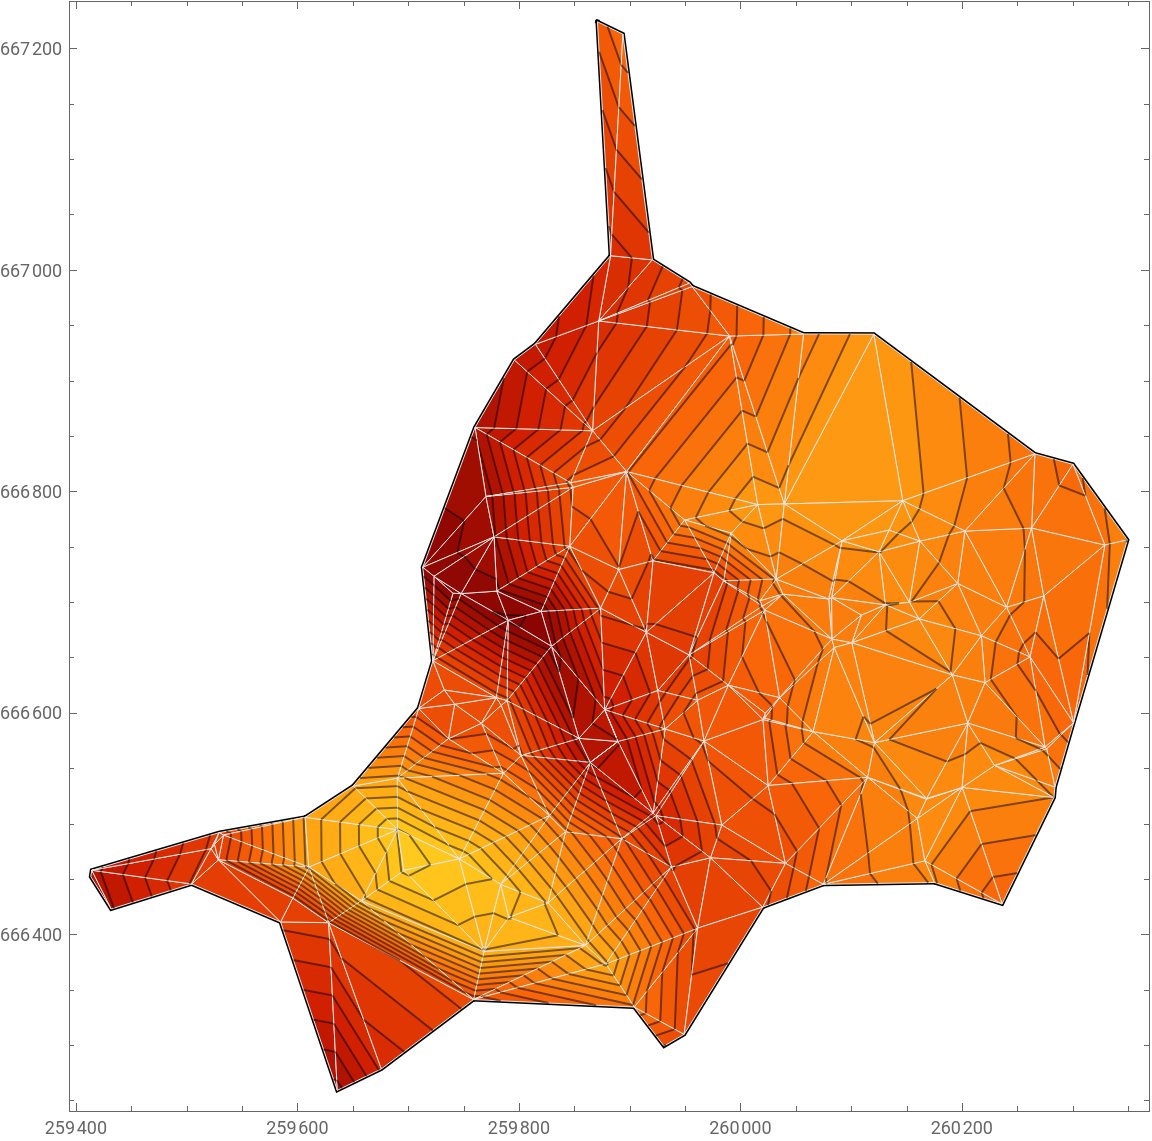
Some unexpected behaviours when setting InterpolationOrder?
Some unexpected behaviours when setting InterpolationOrder?
Case 1: Raw data linearly interpolated - looks correct
Case 1: Raw data linearly interpolated - looks correct
This plot looks correct with contour lines interpolated linearly.
In[]:=
ListContourPlot[pts,Contours->contours,ImageSize->Medium,InterpolationOrder->3,Mesh->None,PlotLegends->None]
Out[]=
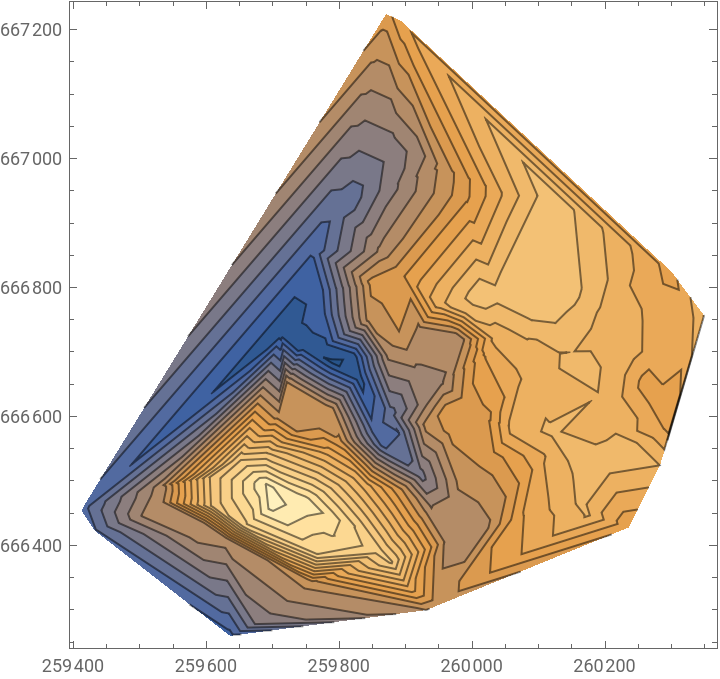
Case 2 : Setting a value for MaxPlotPoints, InterpolationOrder not explicitly set
Case 2 : Setting a value for MaxPlotPoints, InterpolationOrder not explicitly set
This plot still looks correct with contour lines interpolated linearly.
In[]:=
ListContourPlot[pts,Contours->contours,ImageSize->Medium,
MaxPlotPoints->200
,
Mesh->None,PlotLegends->None]Out[]=
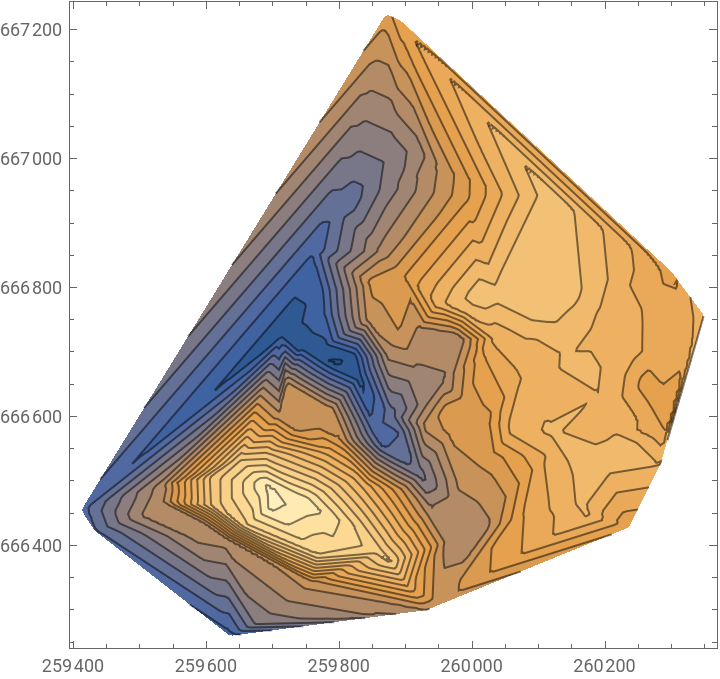
Case 3 : Setting a value for MaxPlotPoints, InterpolationOrder set to Automatic
Case 3 : Setting a value for MaxPlotPoints, InterpolationOrder set to Automatic
This plot looks different - the contour lines no longer appear to be interpolated linearly.
Case 4 : Setting a value for MaxPlotPoints, InterpolationOrder set to 1
Case 4 : Setting a value for MaxPlotPoints, InterpolationOrder set to 1
This plot looks the same as the plot in Case 3 where InterpolationOrder was set to Automatic.
The contour lines do not appear to be interpolated linearly as I’d expect with InterpolationOrder1.
The contour lines do not appear to be interpolated linearly as I’d expect with InterpolationOrder1.
Case 5 : Setting a value for MaxPlotPoints, InterpolationOrder set to 3
Case 5 : Setting a value for MaxPlotPoints, InterpolationOrder set to 3
This plot looks the same as the plot in Cases 1 & 2.
Unexpectedly, the contour lines now appear to be interpolated linearly!
Unexpectedly, the contour lines now appear to be interpolated linearly!