E1P ↔ Wolfram Physics Mapping
Phase 0 — Baseline multiway structure
Date:
Wolfram Version: 14.3.0 (Mac ARM)
Kernel: Local Desktop
Purpose:
Establish whether multiway evolution exhibits structured, non-random phase behavior
prior to introducing E1P operators.
Phase 0 — Baseline multiway structure
Date:
Wolfram Version: 14.3.0 (Mac ARM)
Kernel: Local Desktop
Purpose:
Establish whether multiway evolution exhibits structured, non-random phase behavior
prior to introducing E1P operators.
In[]:=
{$Version,$MachineName,Head@MultiwaySystem,Head@BranchialGraph,Head@CausalInvariantQ}
Out[]=
{14.3.0 for Mac OS X ARM (64-bit) (July 8, 2025),Mac-Studio,Symbol,Symbol,Symbol}
In[]:=
PacletInstall["SetReplace"]<<SetReplace`WolframModel[{{x,y},{y,z}}->{{x,z},{y,w},{w,z}},{{0,1},{1,2},{2,3}},30,"FinalStatePlot”]
Out[]=
PacletObject

In[]:=
<<SetReplace`rule={{x,y},{y,z}}->{{x,z},{y,w},{w,z}};init={{0,1},{1,2},{2,3}};(*Justrunthemodelandseewhatweget*)result=WolframModel[rule,init,10];(*Checkwhatresultcontains*)result
Out[]=
WolframModelEvolutionObject


In[]:=
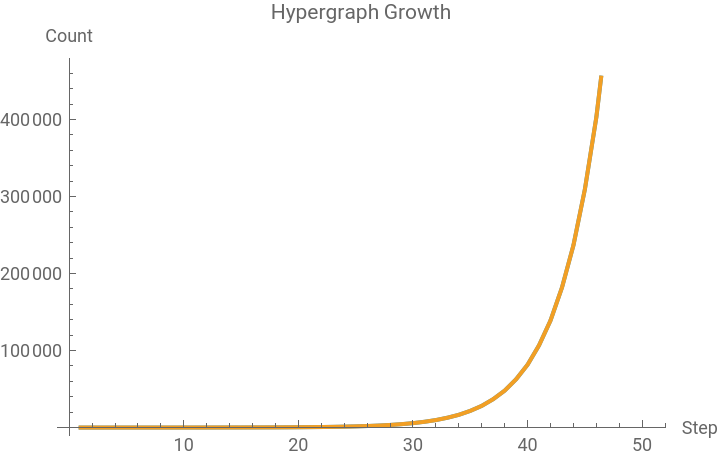
<<SetReplace`(*Runevolutionandgetpropertiesateachstep*)rule={{x,y},{y,z}}->{{x,z},{y,w},{w,z}};init={{0,1},{1,2},{2,3}};evolution=WolframModel[rule,init,50,"StatesList"];(*Countedgesateachstep*)edgeCounts=Length/@evolution;(*Countuniquenodesateachstep*)nodeCounts=Length[Union[Flatten[#]]]&/@evolution;(*Plotgrowth*)ListLinePlot[{edgeCounts,nodeCounts},PlotLegends->{"Edges","Nodes"},AxesLabel->{"Step","Count"},PlotLabel->"Hypergraph Growth"]
Out[]=


In[]:=
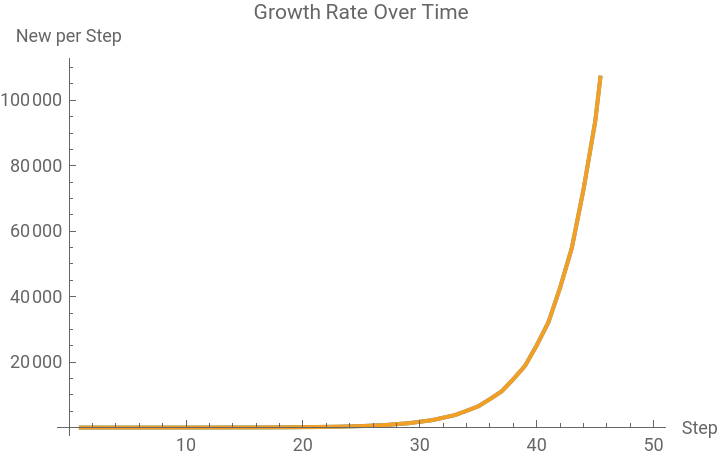
(*Rateofchange-wherestructuremightappear*)edgeGrowthRate=Differences[edgeCounts];nodeGrowthRate=Differences[nodeCounts];ListLinePlot[{edgeGrowthRate,nodeGrowthRate},PlotLegends->{"Edge Growth Rate","Node Growth Rate"},AxesLabel->{"Step","New per Step"},PlotLabel->"Growth Rate Over Time"]
Out[]=
In[]:=
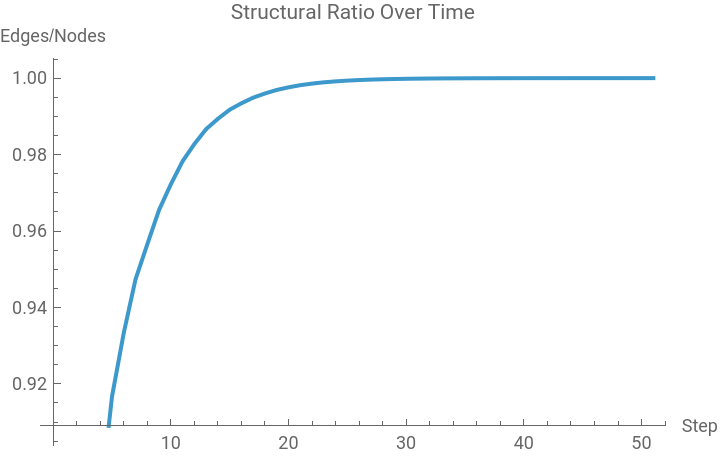
(*Ratio-structuralcomposition*)edgeNodeRatio=edgeCounts/nodeCounts;ListLinePlot[edgeNodeRatio,AxesLabel->{"Step","Edges/Nodes"},PlotLabel->"Structural Ratio Over Time"]
Out[]=
In[]:=
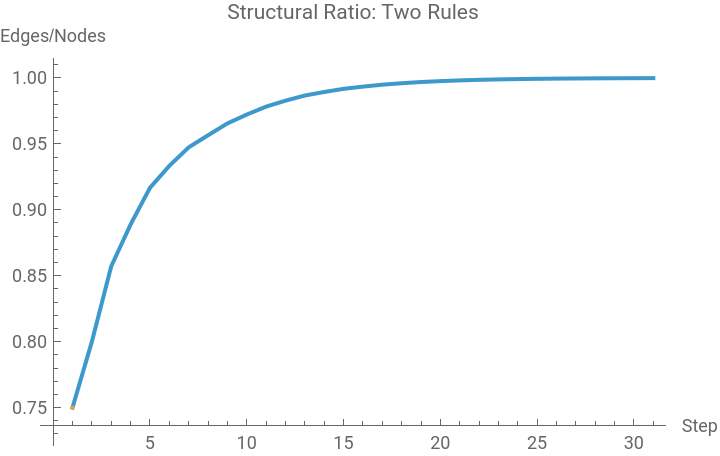
(*Comparetworules*)rule1={{x,y},{y,z}}->{{x,z},{y,w},{w,z}};rule2={{x,y},{x,z}}->{{x,y},{y,z},{z,w}};init={{0,1},{1,2},{2,3}};evolution1=WolframModel[rule1,init,30,"StatesList"];evolution2=WolframModel[rule2,init,30,"StatesList"];ratio1=(Length/@evolution1)/(Length[Union[Flatten[#]]]&/@evolution1);ratio2=(Length/@evolution2)/(Length[Union[Flatten[#]]]&/@evolution2);ListLinePlot[{ratio1,ratio2},PlotLegends->{"Rule 1","Rule 2"},AxesLabel->{"Step","Edges/Nodes"},PlotLabel->"Structural Ratio: Two Rules"]
Out[]=
In[]:=
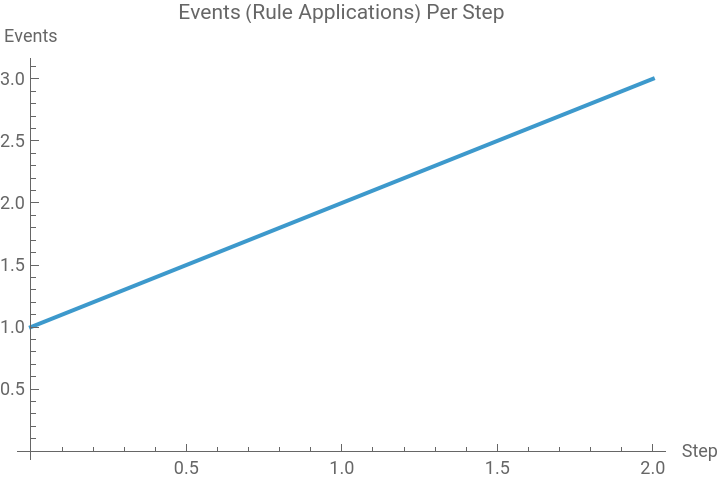
(*Getthemultiwaycausalgraph*)result=WolframModel[rule1,init,15];(*Howmanypossiblenextstatesateachstep?*)(*Thismeasures"branching potential"-closertoCC*)statesList=result["StatesList"];eventsList=result["EventsList"];(*Eventsperstepgivesusactivityrate*)eventsPerStep=Length/@result["EventsCountList"];ListLinePlot[eventsPerStep,AxesLabel->{"Step","Events"},PlotLabel->"Events (Rule Applications) Per Step"]
Out[]=