CITE THIS NOTEBOOK: Explicit construction of an observer of the simple harmonic oscillator by Matthew Kafker. Wolfram Community JAN 8 2022.
We construct an observer which measures the period of a simple harmonic oscillator.
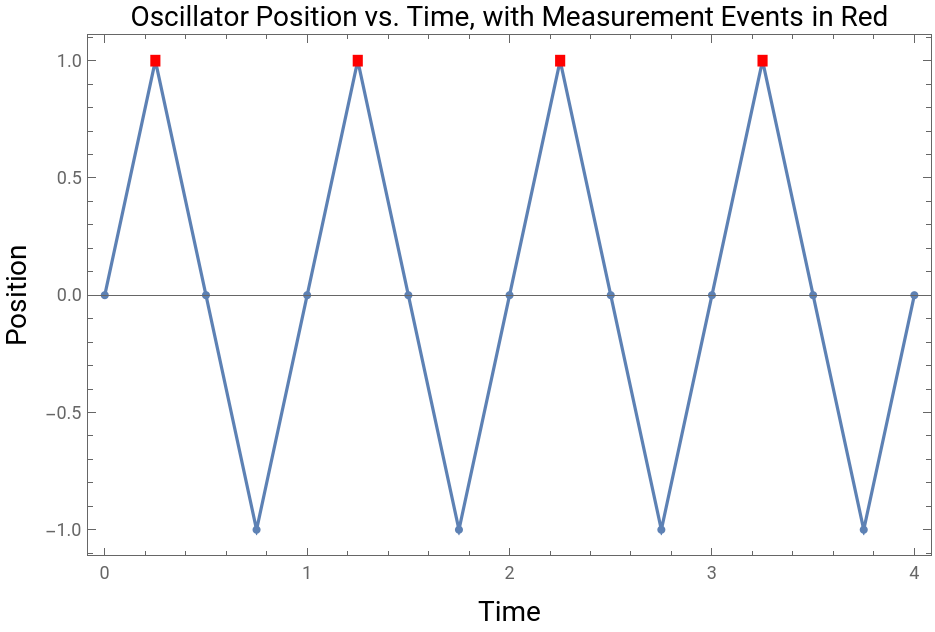
The observer makes a measurement (an “event”) when the oscillator reaches the right turning point.
The observer makes a measurement (an “event”) when the oscillator reaches the right turning point.
In[]:=
times=Range[0,4,0.25];pos=Sin[2πtimes];
In[]:=
Show[ListPlot[{Transpose[{times,pos}]},Joined->True,PlotMarkers{Automatic,Scaled[0.02]},Frame->True,FrameLabel->{Style["Time",Black,14],Style["Position",Black,14]},PlotLabel->Style["Oscillator Position vs. Time, with Measurement Events in Red",Black,14]],Module[{turningpointnodes,point},turningpointnodes=Select[Transpose[{Range[1,Length[#]],#}]&@pos,Abs[#[[2]]-1]<&][[All,1]];Graphics[Table[point={times[[i]],pos[[i]]};{Red,Rectangle[point-{0.025,0.025},point+{0.025,0.025}]},{i,turningpointnodes}]]]]
-5
10
Out[]=
Construct the Observer
Construct the Observer
(*Findturningpoints*)turningpointnodes=Select[Transpose[{Range[1,Length[#]],#}]&@pos,Abs[#[[2]]-1]<&][[All,1]];timeedges=Table[#[[i]]#[[i+1]],{i,Length[#]-1}]&@times;causaledges={};causalnodes={};causalcounter=1;(*Attachcausaleventstotimenodes*)(************************)Do[Do[If[i==j,AppendTo[causaledges,times[[i]]StringJoin[ConstantArray["a",causalcounter]]];AppendTo[causalnodes,StringJoin[ConstantArray["a",causalcounter]]];causalcounter+=1;],{j,turningpointnodes}],{i,Length[times]}];(************************)(*Determinecounternodestoattachtotimenodes*)(************************)counteredges=ConstantArray[{},Length[times]];counternodes={};countercounter=1;Do[Do[AppendTo[counteredges[[i]],StringJoin[ConstantArray["b",countercounter]]];AppendTo[counternodes,StringJoin[ConstantArray["b",countercounter]]];countercounter+=1;,{i,j,Length[times]}],{j,turningpointnodes}];(************************)(*Attachcounternodestotimenodes*)(************************)finalcounteredges=Catenate[Table[If[Length[counteredges[[i]]]>0,PrependTo[counteredges[[i]],times[[i]]];Table[counteredges[[i]][[j]]counteredges[[i]][[j+1]],{j,Length[counteredges[[i]]]-1}],Nothing],{i,Length[counteredges]}]];(************************)
-5
10
Visualize the Observer
Visualize the Observer
Define vertex shapes.
redsq=Graphics[{RGBColor[1,0,0],Rectangle[{0,0},{1,1}]}];bluecircle=Graphics[{RGBColor[0,0,1],Disk[{0,0}]}];greentriangle=GraphicsRGBColor0,,0,Triangle{0,0},{1,0},0.5`,;
4
9
3
2
Visualize the observer.
In[]:=
Legended[Graph[Join[timeedges,causaledges,finalcounteredges],VertexShape->Flatten[{Map[#->redsq&,causalnodes],Map[#->greentriangle&,counternodes],Map[#->bluecircle&,times]}],GraphLayout->"LayeredDigraphEmbedding",AspectRatio->0.5,PlotLabel->Style["The Observer",Black,20]],{Thumbnail[bluecircle]->"Time Node",Thumbnail[greentriangle]->"Counter Node",Thumbnail[redsq]->"Event Node"}]
Out[]=
|
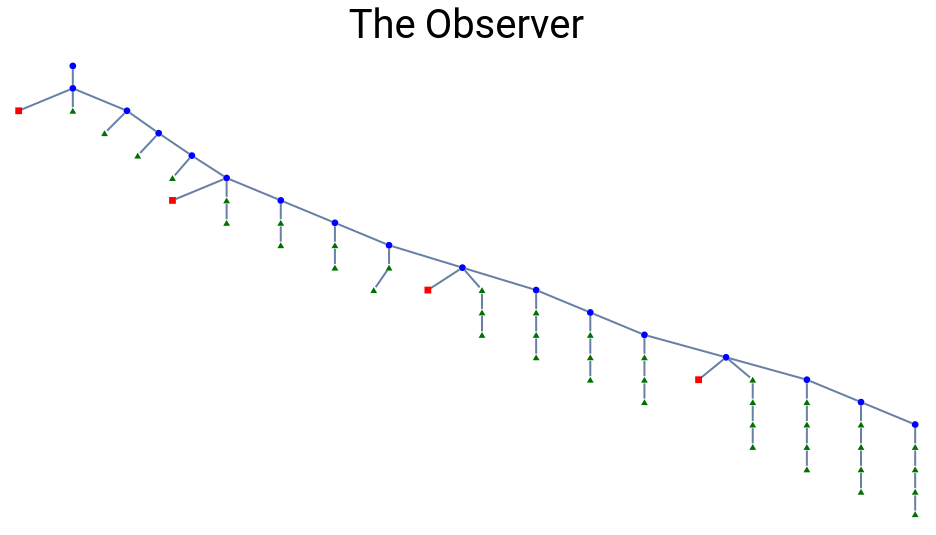


The observer consists of two types of entities: - Time nodes (blue circles). These are added every unit of time measured by the observer. (In this case, the observer measures time in simulation time.) - Counter nodes (green triangles). These keep track of the total number of events (red squares) which have taken place. The events (red squares) indicate that that the oscillator has reached the right turning point. The events are not part of the observer, but rather represent measurements made by the observer of the physical system. When the observer detects an event (red square), it adds a green triangle (count) to all subsequent time nodes. Time should thus be visualized as flowing along the blue nodes from the top of the page to the bottom.The period of the oscillator (or more generally, the rate of events) is now encoded in the structure of the observer, as the ratio of the total count (rightmost collection of green triangles) to the total number of time steps (blue circles). No external labels such as the event time are required. The only missing information is the duration of one time step.This same observer construction can be used to measure the rate of events of any process.