Using the AnatomyData it is possible to obtain information about different anatomical regions.
In[]:=
EntityClass["AnatomicalStructure","BodyParts"]//EntityList//Short
Out[]//Short=
,,,,,,,,,,,,,,,,,,,,,,,,,,,,,,,,,,,,,,,,,100,,,,,,,,,,,,,,,,,,,,,,,,,,,,,,,,,,,,,,,,
As well as extract detailed information for a single anatomical structure.
Let’s pick the Heart, a vital organ that everyone knows. It plays a central role in the circulatory system, responsible for pumping blood throughout the body with its continuous and rhythmic pumping action is essential for maintaining the body’s overall health and function.
However,
However,
In[]:=
heart=Entity["AnatomicalStructure","Heart"]heart["Dataset"]
Out[]=
Out[]=
| ||

Using the AnatomyData library it is very easy to discover detailed information, like the location:
In[]:=
AnatomyData,"BodyLocationImage"
Out[]=
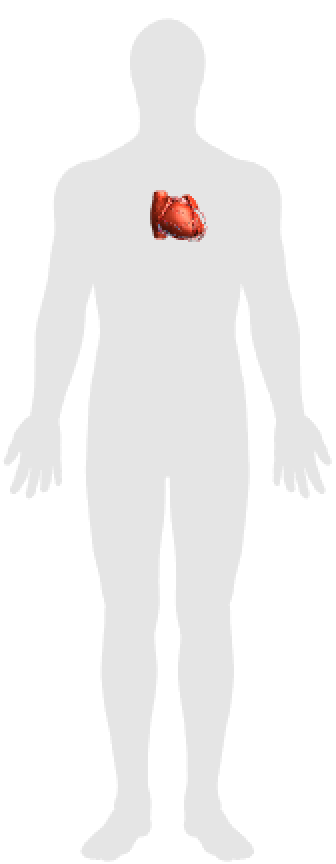
Or very detailed medical-based information like the arteries which take blood to the heart:
In[]:=
supplyingArteries=AnatomyData,"ArterialSupply"
Out[]=
,,,,
In[]:=
drainingVeins=AnatomyData,"VenousDrainage"
Out[]=
,,,,,,
And we can also use this library to visualize and interact with 3D representation of the anatomical entities.
In[]:=
Out[]=

Regions highlight
Regions highlight
We can also combine anatomical information to highlight different structures.
Remaining with the example, there are two main types of vessels: artery, which transport blood rich in oxygen, and veins, which transport blood poor in oxygen. Generally, due to the different contents in oxygen, they are represented using different colors: red for arteries and blue for veins.
In[]:=
veinC=RGBColor["#00008B"]arteriyC=RGBColor["#DC143C"]
Out[]=

Out[]=
In[]:=
detailedHeart=AnatomyPlot3D,PlotTheme->"Monochrome",Quiet[AnatomyPlot3D[{arteriyC,supplyingArteries}]],Quiet[AnatomyPlot3D[{veinC,drainingVeins}]];
In[]:=
Show[detailedHeart]
Out[]=

Using the same library it is also possible to discover and investigating different anatomical regions. Let’s pick the :
In[]:=
Entity["AnatomicalStructure","Neck"]["Graphics3D"]
Out[]=
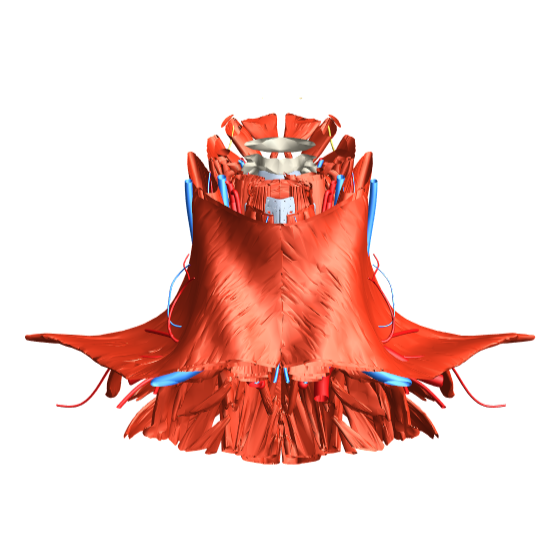
There are clearly a lot of anatomical structures but we can still highlight some vessels.
In[]:=
Out[]=
,,,,,,,,,,
Let’s pick the and search for similar structures. It is a middle vessel that originates two branches, in addition, it also a bilateral structures returing a total of four branches.
In[]:=
arteries=["BilateralComponents"]branches=Flatten@(#["Branches"]&/@arteries)
And we can visualize these structures with respect to the anaomtical region of the body:
Animation
Animation
Let’s come back to the Heart 3D visualization. Instead of manually rotating it, we can vary the orientation and create an animation.
By fixing the ViewVertical as the third axis, aligned with the body orientation, we can vary the orientation of the ViewPoint:
And we can define a custom function to rotate the plot with respect to the angle θ :
In the end, it became very easy to create several frames and generate an animation:
CITE THIS NOTEBOOK
CITE THIS NOTEBOOK
Anatomy data for visual representation: teaching and research
by Alessandro Mastrofini
Wolfram Community, STAFF PICKS, February 1, 2024
https://community.wolfram.com/groups/-/m/t/3114056
by Alessandro Mastrofini
Wolfram Community, STAFF PICKS, February 1, 2024
https://community.wolfram.com/groups/-/m/t/3114056