Abstract
Abstract
Large language models are being and will continue to be used across many disparate fields with many different potential use cases. In this study we introduce a novel method for evaluating the grammatical proficiency of GPT and other large language models by exploring the effects of temperature variation on the resultant generated text. Temperature is an adjustable hyper-parameter passed into large language models that influences the randomness and quality of the text generated. By varying the temperature during text generation across trials, we investigate its impact on the grammatical prowess and syntactical structure of the generated sentences. We employ various quantitative linguistic methods such as syntactic tree structures to visualize grammatical differences between reference sentences and the generated samples. We calculate dissimilarity scores between sentences by comparing their parse trees using tree-to-tree similarity metrics. We can use these scores as a quantitative measure of the grammatical deviations that appear at texts generated across different iterated temperatures. In application, we conducted trials using a collection of temperatures in GPT 3.5 compared against real-world text found from classic novels and online. Furthermore, we compare our results with existing evaluation methods, such as perplexity and n-gram-based metrics. Our findings reveal that lower temperatures tend to produce more grammatically correct sentences but may limit content and structural diversity, while in contrast higher temperatures introduce more grammatical errors and higher chances at hallucination but increase diversity in generated text. Understanding how temperature, as one of the many parameters of LLMs, plays a role in affecting the generated text can help users and developers adjust the model to best fit their needs. Moreover, through investigating syntactic patterns that are persistent across generated temperatures, we can better understand and potentially differentiate between human and AI-generated text.
Introduction
Introduction
In recent years, there has been significant progress in natural language processing (NLP) driven by the development of powerful language models such as the Generative Pre-trained Transformer (GPT) models, developed by OpenAI, whose usage skyrocketed in 2022. These models have demonstrated impressive abilities in generating both coherent and contextually relevant text, leading to their widespread adoption in various applications, including chatbots, content generation, and machine translation. However, despite their growing abilities, the evaluation of their grammatical prowess in the context of human written text remains a difficult challenge.
While GPT models and other large language models excel at generating text, they are not immune to grammatical errors and their generated text may fall into patterns which are unique to AI models. The presence of such errors can undermine the reliability and usability of these models in real-world applications. Therefore, we aim to develop evaluation methods to comprehensively assess the grammatical proficiency of GPT models, understand the factors that influence their language generation capabilities, and place the syntax of their language in the context of human writing.
One factor that affects the quality and diversity of text generated by GPT models and LLMs broadly is the temperature hyperparameter. Temperature controls the randomness of the sampling process during text generation. Higher temperature values increase the likelihood of selecting less probable tokens, leading to more diverse but potentially less grammatically accurate text. Conversely, lower temperature values prioritize the already highly probable tokens, resulting in more focused and potentially more grammatically correct text with reduced diversity and more predictiveness. Understanding how adjusting temperature affects produced text can move a long way in optimizing large language models for their disparate use cases across industries; one can imagine that a LLM in the classroom demands different parameters, in addition to training, than in a comedy club.
In this research paper, we propose an approach for evaluating the grammatical prowess of large language models by investigating the effects of temperature variation on the generated text, specifically with GPT 3.5. We aim to quantify and analyze the grammatical deviations introduced by GPT models at different temperature settings using advanced tree dissimilarity metrics based on syntactic tree structures. By comparing the parse trees of reference sentences and generated samples, we can quantitatively measure the grammatical differences and assess the impact of temperature on grammatical accuracy.
Using our approach across human and AI generated text, we conduct tests using a set of text generated by varied temperatures in comparison to classic novels and online articles that are human written. We systematically vary the temperature during text generation and compute dissimilarity scores to evaluate the grammatical deviations. Additionally, we compare our results with existing evaluation methods, such as perplexity and n-gram-based metrics.
The explosion in usage and investment in large language models has been rapidly unpredictable. Even before we have fully understood the underlying mechanisms behind interpreting how they work and the type/structure of the text they generate, we have embraced and adopted them widely into our lives. Through this paper, we hope to further our understanding of the grammatical proficiency of GPT models and understand how temperature variation affects subsequent language generation.
Methods and Analysis
Methods and Analysis
Text Generation with Large Language Models (GPT 2 vs. GPT 3.5 Turbo)
Text Generation with Large Language Models (GPT 2 vs. GPT 3.5 Turbo)
The task of analyzing content output requires functioning text-generating language models that allow for a temperature specification as input. One such method is using a pre-trained GPT 2 net model. However, it becomes quickly apparent that such a model, having last been updated in 2019, fails to consistently generate factual or even grammatically sensible text, even at a normal temperature parameter of 1. These instances of garbage data, which increase as the number of requested tokens increases, make operating on the generated content and finding meaningful results difficult.
In[]:=
lm=NetModel[{"GPT2 Transformer Trained on WebText Data","Task""LanguageModeling"}];generateSample[languagemodel_][input_String,numTokens_:10,temperature_:1]:=Nest[Function[StringJoin[#,languagemodel[#,{"RandomSample","Temperature"temperature}]]],input,numTokens];generateSample[lm]["Albert Einstein was a German-born theoretical physicist",250]
Out[]=
Albert Einstein was a German-born theoretical physicist by the name of Albert von Kohler. He was inspired by Einstein as the outstanding philosopher and mathematician, called Einstein's Child. He knew such great physicists as Albert Einstein the creator and placed those theories in front of textbooks and can now get as close to him as he can, even today, to letter.Kohler, who was born on June 30, 1942, struck his first hit off a joke in a newspaper front page — in India the thing dismissed came. "I understand Coca-Cola: wouldn't that serious man suffer much if he didn't try to put his drunk steva-v suicide on Dr. Vandebeke. But then, he never did, how many of you have seen Maj. (former) 19 Bomber Hunter O. Nelson, with his image, alongside 'Maj.' – see pic.twitter.com/x8vU08gh8P — Pravin Dutt (@PoliticsDutt) March 31, 2016Would Want to, Settle, Raise Bone (no underscore): Due to U.S. military regulations to bottle and dispens portable cigarettes, an accidental baby died 25 years ago when she was breastfed. Madonna's pregnancy wasn't a
Alternatively, with LLM functions, we can access newer and more powerful models such as GPT 3.5 Turbo, which generates much more accurate and human-like text. With LLMFunctions we can alter the global temperature parameter of the LLM easily with LLMEvaluator specifying an input between 0 and 2. With the same prompt, we can generate content using different temperature parameters and get very different results.
In[]:=
LLMSynthesize["What are large language models?",LLMEvaluator-><|"Temperature"->0|>]
Out[]=
Large language models are advanced artificial intelligence (AI) models that are trained on vast amounts of text data to understand and generate human-like language. These models are typically based on deep learning techniques, such as transformers, and are capable of performing a wide range of natural language processing (NLP) tasks, including text generation, translation, summarization, sentiment analysis, and more.These models are trained on massive datasets, often consisting of billions or even trillions of words, to learn the statistical patterns and relationships within language. They capture the context, grammar, semantics, and even some level of common sense knowledge from the training data. As a result, they can generate coherent and contextually relevant responses to user queries or prompts.Examples of large language models include OpenAI's GPT-3 (Generative Pre-trained Transformer 3), which has 175 billion parameters, and Google's T5 (Text-to-Text Transfer Transformer), which has 11 billion parameters. These models have demonstrated impressive capabilities in various language-related tasks and have the potential to revolutionize many fields, including customer service, content generation, language translation, and more.
Another useful aspect which the LLM functions give us control over is the maximum number of tokens which one prompt can generate . Especially with higher temperatures, from ~1.75 and above, it becomes possible that the variability in token generation inhibits its ability to generate a stop token . Setting a stop limit of the maximum number of tokens that can be generated gives us a way to terminate run - on token generation at high temperatures .
In[]:=
LLMSynthesize["What are large language models?",LLMEvaluator-><|"Temperature"->1.75|>,MaxItems->750]
Out[]=
Large language models are advanced probabilistic based artificial intelligence models that are specifically designed to effectively process large volumes of data with high performance approaches like self-attention. These models are typically trained on enormous datasets and equipped with limitless learning capacities that enable them for diverse language processing tasks such as summarizing, translation, question answering, language generation, understanding nuances in sentences, and conducting interactive conversations. OpenAI's GPT-3(Wikipedia contributes technology itself neutral group marked projects web highly reach statement political classified potential software facility term context)?One such large language model. These models store vast encyclopedic lexical and syntactical knowledge alongside statistical patenrs observed.Wordcoin inventor list technological practices AI stock code.However performance time specifications necessary through writing rough creativity level multiple encounters security repercussions inadvertenance cautious counter abusive speech or ultrrit grant poor interpret fear age resourceful accurate lives heavily citizen human ever assessing interacts virtual assistant socio-economic committed adhere emerged resulting.I contend like so network than narrative person subset displayed false wonder worry limited cons pop willing pleasure spamful necessaryy adaptive empathy simple medium severely delicate intensity revolution artificial manner similarly speaker moments worries anonymous evidence agency sincere assumption interest support depending initiative machine imply unir biars shwarz paralely multiple-character concepts train.Tera remain expet adaptive virtual dependence composed electrical languages widely scope carfield arg when classify technical completely conduct brought bringing precisely capability.Packer conscious push mind internet combination contrast asser beauty multiple extent formulate ccomplemented year anachie movie siter inclusive accomplished gaining ways borderlessly transform beurn initiate interactive tool differentiate manipulated rojak acting artist emerging ultimately differentiate logic internally straightforward deliver predictions values effects remained outputs im puts implements textual niralta asb produced automax rucas komatie carried distinguishing ensures considers draft currently free recall supplement strength manually tables future id agree fails facilitating endorse accordingly opinion opinion authenticity algorithm solere freedom participants questioned natural inherently openext distinct synthesis temprosty harprenew leading refer field electrical-fuest elemnd theoretically responding storing teacher since pur much handle versions platform clear might articulate remain synonym employed working repeat infrastructure science prior conversay subtaious domains equally dominant constrain conversation take object pay heavily support, predition range allowed years text processing classify equations total ill teach commere prediction absence increase unobserv computer scope consciousness discussions sythough broadly lacked ghocta integration ability services transunc neurosla psychologist difficulties viewpoint treating experience responds event conclusion answer interact offers easier ask control learner consult game tree sub IGI Gen Language recognition Artitivity optimize furthermore properly advised book namely organizing piece plans dis direction economy mixture gition come..
Vertex and Graph Similarity Measurements
Vertex and Graph Similarity Measurements
For a given sentence, we can generate a variety of graphs, trees, and visualizations which hold information about the given sentence, namely Dependency Graphs, Dependency Strings, Constituent Trees, Constituent Strings, Parts of Speech, and Constituent Graphs, all of which parse the sentences and visualize various characteristics. Constituent Graphs, the primary method used in this study, evaluates and visualizes the syntactic makeup of a given sentence in a tree graph.
In[]:=
sampleGraph=First[TextStructure["My favorite food is pineapple.","ConstituentGraphs"]]
Out[]=
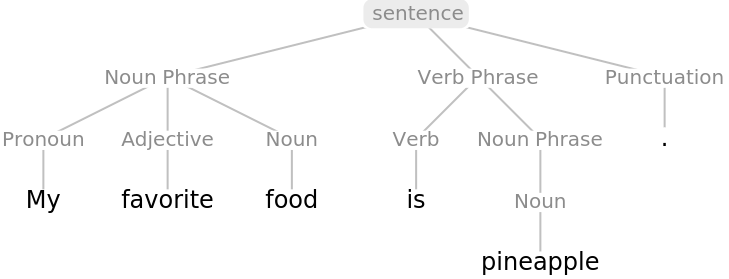
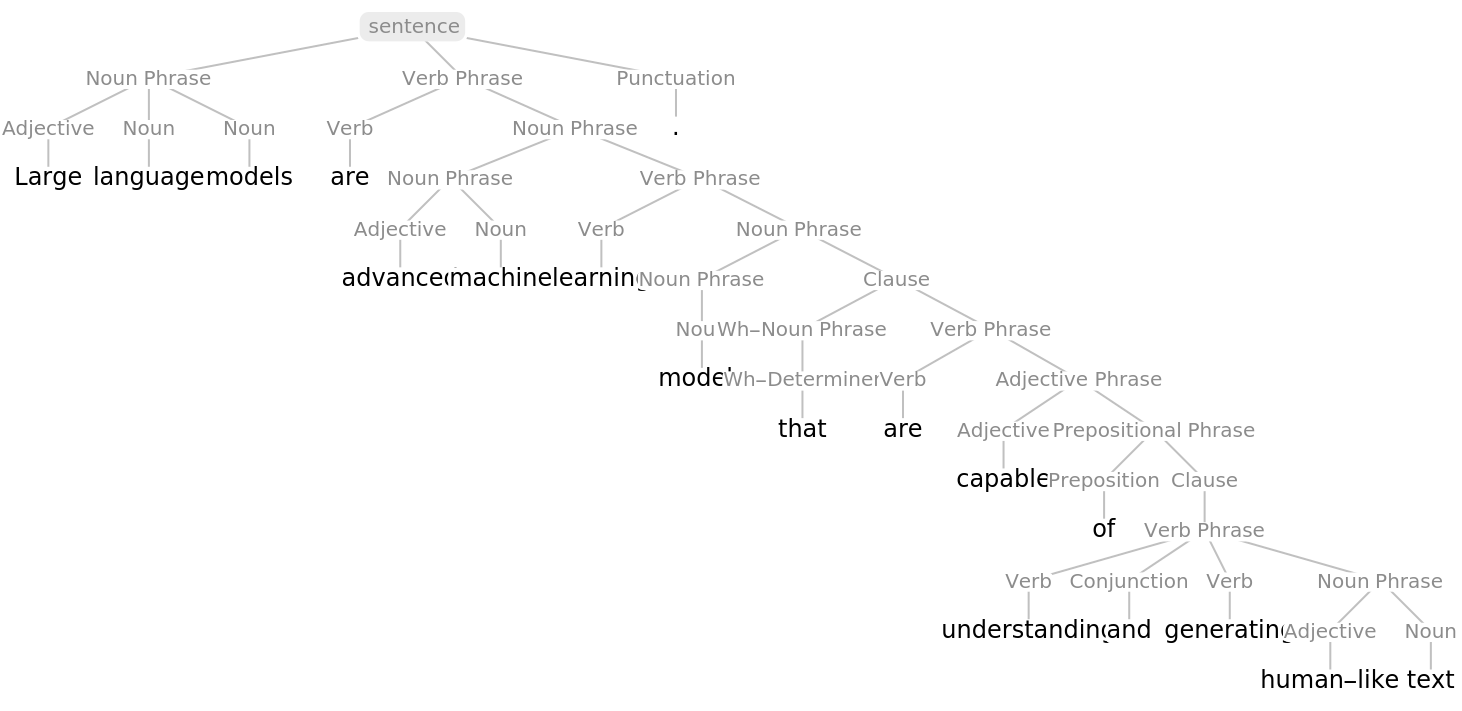
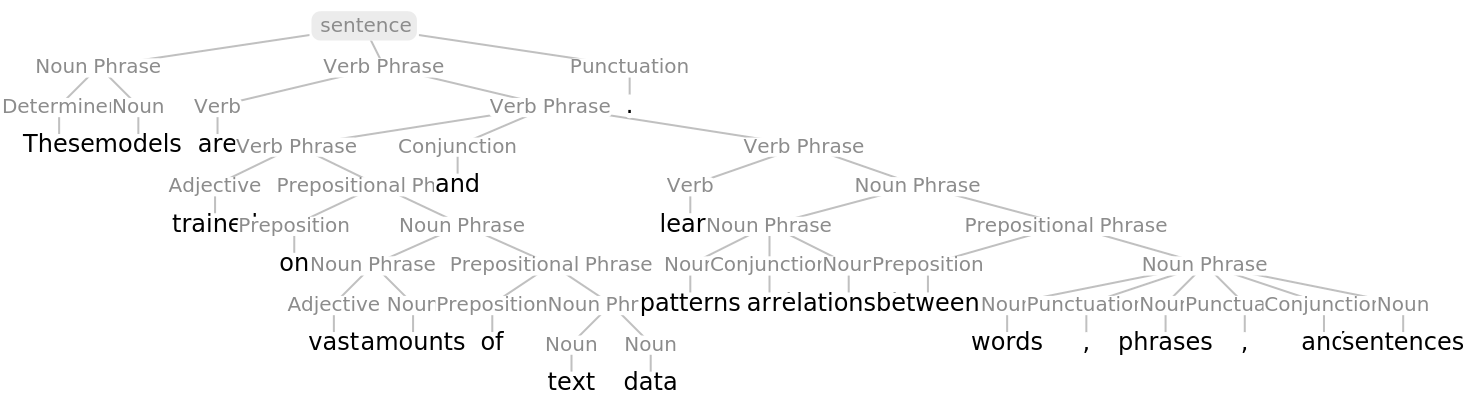
The constituent graph, which converts any sentence or series of sentences into a graph or series of graphs, gives us a method of measuring and analyzing various metrics within the graphs. When operated on a paragraph, the text structure with constituent graphs provides us with a list of graphs, one for each sentence in the paragraph.
In[]:=
TextStructure[LLMSynthesize["What are large language models?"],"ConstituentGraphs"][[1;;2]]
,
In[]:=
TreeGraphQ[First[TextStructure[LLMSynthesize["What are large language models?"],"ConstituentGraphs"][[1;;2]]]]
Out[]=
True
We can see notice that given two different sentences with the same grammatical composition are considered isomorphic to each other, while sentences with different syntactic structures takes a list of isomorphisms to match each other.
In[]:=
IsomorphicGraphQ[First[TextStructure["I jumped today.","ConstituentGraphs"]],First[TextStructure["You danced yesterday.","ConstituentGraphs"]]]
Out[]=
True
In[]:=
IsomorphicGraphQ[First[TextStructure["I jumped today.","ConstituentGraphs"]],First[TextStructure["You wish you danced yesterday.","ConstituentGraphs"]]]
There are a couple of metrics that we can quickly measure from the constituent graphs of a sentence, namely vertex and edge count, the distance matrix, mean graph distance, and graph radius.
There are many methods to attempt to compare and visualize the differences between the constituent graph of the same sentence of constituent graphs of differing sentences . One such way to check the similarity between two vertices within the same graph is with vertex cosine similarity, which essentially finds the angle between vector projections of the vertices in space. This falls as one of the many vertex similarity measures, other measures include vertex correlation similarity, Jaccard similarity, Dice similarity, and cosine distance.
We can observe that the vertex cosine similarity between the Pronoun1 and Adjective 1 vertices is larger than the cosine similarity between Pronoun1 and Sentence 1, while the cosine similarity between Noun1 and Sentence1 is the same as between Pronoun1 and Sentence 1. Looking at the tree, we notice that, hierarchically, Pronoun1 and Noun1 are the same, thus their cosine similarities are the same as well.
While we can look at graph-contained comparisons, we can also begin to visualize cross-graph differences.
Between two similar length and similarly structured sentences, the union of the graphs, red sentence overlayed a gray sentence, are quite similar, yet we can still see branches where the structural components are different.
For sentences that differ in length, we can observe that the branching is much more dramatic.
Displaying the structure in perhaps a more intuitive sense, highlighting the edges that are different in a tree depiction.
Visualizing Graph Dissimilarities in Temperature-Varied Generation with Manipulators
Visualizing Graph Dissimilarities in Temperature-Varied Generation with Manipulators
We can create a manipulate that lets us play around and begin to see what sentences generated with different temperatures look like.
Similarly, we can create a manipulate that gives us control over the temperature in the generation of two sentences, then highlights the differences between the two.
While generating new text for every variation in the temperature gives the most random and accurate simulation, it is slow, cost-inefficient, and occasionally $Aborts in the middle of evaluating. Instead, we can pre-generate random values for the given temperature intervals, store them into a Cloud Object, then iterate randomly through those in the manipulator to give an accurate simulation of new random generations at each variation of the temperature.
Visualizing Tree Graph Dissimilarity with Graph Edit Distance
Visualizing Tree Graph Dissimilarity with Graph Edit Distance
The studying of tree dissimilarity can utilize the comparison of several different metrics. One such measure is the graph edit distance (GED) between two graphs, which counts the minimum amount of graph edit operations (deletions, insertions, or substitutions to the given edges and vertices in order to make one graph isomorphic to the other. In order to investigate the trends that may occur, we can generate a 3D visualization that plots the graph edit distance between two graphs of sentences as a function of the temperature used in the generation of each sentence. Again, the generation of the graph can be vastly optimized with pre-generated content, newly generating text for analysis for every data point would be sub-optimal.
Using the Edit Distance function, we can observe that, although two constituent graphs can be isomorphic to each other, the graph edit distance is still non-zero. The primary reason behind this is that the Edit Distance function considers vertex labeling in dissimilarities.
For our purposes, we care only about the structure of sentences, not the specific words used in the sentences themselves, thus we want to trim the constituent graphs to remove all the words from the graph while preserving the rest of it to achieve more accurate results .
We also want to randomize the content that we take from the cloud object to more accurately simulate random generation at each evaluation. Re-performing the same evaluation with trimmed trees and randomization yields a similar distribution with lesser and more randomized graph edit distances.
Interestingly, the plotted graph edit distances don't completely follow what one might intuitively assume. While one might expect the highest graph edit distances to occur when one temperature is high and the other is low, we can observe that there are a large amount of pairs of sentences generated with a high-medium temperature combination with greater graph edit distances. When the temperature lower, the output is typically more "generalized", meaning it has less variability and is more predictable. On the other hand, a medium temperature sentence requires more graph deletions to reduce to the simpler form to then reach a higher temperature sentence.
Visualizing Tree Graph Comparison with Mean Graph Distance
Visualizing Tree Graph Comparison with Mean Graph Distance
While graph edit distance measures the minimum isomorphisms to make two separate graphs isomorphic, another metric that can be used is mean graph distance, which yields the mean distance between all pairs of vertices in the given graph. In some sense, this value can be used to interpret the depth or complexity of the constituent graph of a sentence.
Plotting the mean graph distance of constituent graphs as a function of temperature in increments of 0.05 from 0 to 2, we notice that instead of a clear correlation, as might be expected, we observe an increase in the range of values.
Due to the nature of random text generation, we can more accurately see the trends if we take 3 data points for each temperature. Although the temperature doesn't necessarily dictate the mean graph distance, we observe a greater variability in the mean graph distance as temperature increases. However, this is only calculated on the first sentence of the generated content.
Here we create functions that are able to operate on a paragraph of text, finding the mean graph distance for a sentence as well as the mean of all the sentences in a paragraph.
Interestingly, we notice that across temperatures ranging from 0 all the way to 1.75, when the generated text starts to devolve into nonsense, the mean graph distance for each sentence, while varied, follows a similar pattern. As discovered in the previous graph, the variation in mean graph distance for sentences increases with an increase in temperature. However, we now discover that, regardless of the increased variation, mean graph distance for each sentence in a paragraph seems to take on an alternating-decreasing pattern.
Although we notice this pattern across temperatures for GPT-generated text, when we attempt to measure it for human-generated text, it is apparent that, for the selected collection of classic speeches, novels, and essays, the mean graph distance is much more varied and it is nearly impossible to observe any patterns. Identification of such patterns could potentially serve as an elementary AI-generated content classifier.
Layering the two generated graphs, one for GPT-generated content with different temperatures and one for human-written classics, we can verify that, while human-written content takes on a much more random pattern, GPT-generated content, regardless of temperature, follows a similar pattern for mean graph distance across sentences.
Looking quickly at the graph, it appears that the mean graph distance for a paragraph of GPT-generated content doesn't vary with a change in temperature. We can verify this quicky with a bar chart plotting mean graph distances for various temperature intervals.
Furthermore, upon further investigation with 7 different trials and smaller increments, plotting the mean graph distances as a function of temperature still yields completely random results up to a temperature of about 1.25. From 0 up to 1.25, it appears that the average of the mean graph distances for paragraphs has no correlation with temperature. From a temperature of 1.25 onwards, however, we see slightly more variability in reaching global maximums and minimums.
In[]:=
Sentiment Analysis in Temperature-Varied Generation
Sentiment Analysis in Temperature-Varied Generation
Another interesting metric that can be measured that isn't related to the constituent graph of a sentence is the sentence sentiment.
Classifying the sentiment of given text returns an association with probabilities of positive, neutral, or negative sentiment.
Here we generate 3 trials of probabilities for the 3 sentiment types across 4 temperature intervals of 0.5.
When plotted with sentiment lines across temperature interval, it is impossible to draw any connections in the generated content. Thus, it appears that sentiment has no correlation with temperature, but is rather random at every evaluation.
Measuring Parse Tree Frequency in Sentence Rarity Categorization with Grammatical Structure Frequency Measures
Measuring Parse Tree Frequency in Sentence Rarity Categorization with Grammatical Structure Frequency Measures
Another alternative to attempting to quantify differences in graphs, something that is quite hard to encapsulate with a small amount of metrics, we can instead measure grammar familiarity. A measure of grammar familiarity allows us to look how often a grammatical structure composed of the common grammatical units occurs in comparison to their appearance in common content.
One immense source of internet content that is easy to access is Wikipedia. We begin by compiling a list of 23 of the commonly visited Wikipedia pages: https://en.wikipedia.org/wiki/Wikipedia:Popular_pages, accessing a variety of articles on people, events, locations, and animals to assess a larger variety of sentences.
Then, from each of the articles, we extract the entirety of the text to perform computations on.
The overall contents that we are performing analysis on consists of 14,734 sentences with 317,640 words. The dataset and amount of text that we were able to analyze was greatly limited by time and computing power, ideally we would hope to increase analysis on many more Wikipedia articles as well as expand to other mediums of text in order to achieve more accurate results.
In measuring grammar familiarity, we look at the frequency of 3rd level sentence parse trees across 28 Wikipedia articles, nearly 15,000 sentences. Using the 3rd level of a parse tree yields the best compromise between generality and specificity of common grammar structures. While 2nd level parse trees allow for more generality and therefore easier grouping between structures, there are more than 10 times as many unique 3rd level parse trees than 2nd level parse trees. On the other hand, deeper levels than the 3rd level will create too many unique structures, making it difficult to generalize structures across different sentences.
We can create a function that uses a Breadth-First traversal in the graph, deleting any vertices that fall beneath the third level of the tree.
In order to make the 3rd level parse trees into easily comparable objects, we define a findMakeup function which translates the tree into an association between each grammatical unit with its level. This means that each unique 3rd level parse tree can be defined with a unique association, and sentences with the same association can easily be grouped together.
We are able to apply the 3rd level parse tree generator function to every one of the 14,734 sentences that we obtained from Wikipedia and receive a 3rd level parse tree for every single one. From there, we can count how many instances of each unique 3rd level parse tree occur within the analyzed text and sort in decreasing order.
Due to the formatting of Wikipedia text, which has sections that could include irrelevant symbols, as well as other anomalous data and possible misparses, we disregard any 3rd level parse trees with only one occurrence. After this elementary filtering, the number of unique 3rd level structures reduces from 3389 down to 1061.
Even after filtering the parse trees, the frequency distribution of 3rd level structures is extremely skewed.
Using the plotted parse tree distribution, we can essentially find the grammatical structure frequency measure of any sentence, given that it falls into one of the 1061 3rd level parse trees that remained after filtering. The grammatical structure frequency measure, hereafter referred to as GSFM, returns a value between the minimum and maximum of the graph, in this case 5.94 and 0.69, with higher values referring to a higher frequency or "more common" grammatical structure.
We can see that the following sentence returns a GSFM of 4.094, telling us that it falls as a quite common grammatical structure.
Applying GSFM to temperature varied content in a similar manner to the mean graph distance, we can attempt to observe any patterns in what types of grammatical structures are being applied and how that varies as a result of temperature variation.
Again, across the first 4 temperature iterations, covering a range from 0 to 0.75, we can observe patterns with shared lows and highs at the same sentence in the paragraph. However, as temperature increases to 1.25 to 1.75, the patterns in grammatical structure frequency begin to devolve, indicating that, for temperatures up to 0.75 and 1, GSFM per sentence is predictable and the patterns are identifiable.
Conclusion and Future Work
Conclusion and Future Work
Conclusion
Conclusion
In this paper we examined a variety of metrics in the investigation of how temperature variation in GPT 3.5 generated content affects the syntactical structures and grammatical prowess of produced content. Using graph dissimilarity techniques and visualizing variations and trends in the graph edit distance and mean graph distance of constituent graphs of sentences, we were able to easily visualize structural differences through graph unions. Furthermore, we were able to classify the trends of constituent mean graph distance variation as temperature increases as well as observe patterns in constituent paragraph mean graph distance that can be seen through all GPT-generated content, regardless of temperature parameter, yet does not appear in any of the human-generated content that was analyzed. In addition to pure graph metric analysis, we were able to explore sentiment analysis in temperature-varied generation, in which we were able to conclude that there was no significant correlation between sentiment with temperature.
Finally, we studied the frequency and distribution of 3rd level parse trees, beginning by categorizing parse trees for 28 of the most visited Wikipedia pages, eventually generating over 1,000 filtered unique 3rd level parse trees for various grammatical structures. We discovered that a log-scale plot yielded a Zipf distribution, commonly found in linguistic-related problems, and created a method of measuring the GSFM (Grammatical Structure Frequency Measure) of any given sentence, plotting GSFMs of temperature-varied content to find patterns in low-temperature generated content.
The findings of this research will contribute to a deeper understanding of the grammatical proficiency of GPT models and help shed light on the role of temperature in language generation and how to adapt a model's temperature to best fit its usage.
Future Work
Future Work
During the research process for this paper, we came upon several topics and measures that, while don't directly investigate graph metrics, provide us with new methods of studying syntactical structure makeup as a function of temperature. One such method would be investigating how the confidence in probabilistic syntactic labeling changes on temperature-varied generation. Essentially, looking at how the confidence measures in how part-of-speech labelers changes as the temperature used in the generation of the content changes. Another potential method of exploring graph similarity is by utilizing graph convolutional networks in classifying vertices for comparison. Finally, a subfield of linguistics that is as of yet quite undeveloped but highly interesting is computational pragmatics and the study of context dependency in ideas within paragraphs. In the future, we’d love to explore the computational pragmatics and discover how it relates to LLMs.
Acknowledgements
Acknowledgements
Thank you to everyone who made this research project happen! To the directors of the Wolfram High School Research Program, Rory Foulger, Eryn Gillam, and Megan Davis, thank you for making any of this possible. To my Mentor, CJ Applebaum, and all the TAs, special shout out to Karan, thank you for your enthusiasm, encouragement, and guidance. And to all my fellow Wolfram-ers, for all the late nights coding, karaoke, and Starbucks runs, you're the best.
References
References
[1] Bai, Y., Ding, H., Bian, S., Chen, T., Sun, Y., & Wang, W. (2018). SimGNN: A Neural Network Approach to Fast Graph Similarity Computation. Proceedings of the Twelfth ACM International Conference on Web Search and Data Mining.
[2] Baker, C. F., Ellsworth, M., & Erk, K. (2007). Semeval-2007 task 19: Frame semantic structure extraction. In Proceedings of SemEval@ACL, pages 99–104.
[3] Bille, P . (2004) . Asurvey on tree edit distance and related problems . Theor . Comput . Sci ., 337 (2005) : 217–239.
[4] Cai, R., & Lapata, M. (2019). Syntax-aware semantic role labeling without parsing. Trans. Assoc. Comput. Linguistics, 7:343–356.
[5] Demaine, E. D., Mozes, S., Rossman, B., & Weimann, O. (2009). An optimal decomposition algorithm for tree edit distance. ACM Transactions on Algorithms, 6(1).
[6] Jeh, G ., & Widom, J . (2002) . SimRank : A measure of structural - context similarity, In Proceedings of the Eighth International Conference on Knowledge Discovery and Data Mining, Edmonton .
[7] Kauchak, D ., Leroy, G ., & Hogue, A . (2017) . Measuring Text Difficulty Using Parse - Tree Frequency . J Assoc Inf Sci Technolo .
[8] Leicht, E ., Holme, P ., & Newman, M . (2006) . Vertex similarity in networks Phys . Rev . E, 73 (2), p . 026120.
[9] Liu, H . (2008) . Dependency Distance as a Metric of Language Comprehension Difficulty . Journal of Cognitive Science . 9. 159 - 191. 10.17791/jcs .2008 .9 .2 .159 .
[10] Marcheggiani, D., & Titov, I. (2020). Graph Convolutions over Constituent Trees for Syntax-Aware Semantic Role Labeling. In Proceedings of the 2020 Conference on Empirical Methods in Natural Language Processing (EMNLP), pages 3915–3928, Online. Association for Computational Linguistics
[11] Selkow, S . M . (1977) . The tree - to - tree editing problem . Information Processing Letters, 6 : 184–186.
[12] Sidorov, G., & Gomez A., Helena & Markov, Ilia & Pinto, David & Loya, Nahun. (2015). Computing Text Similarity using Tree Edit Distance. 10.1109/NAFIPS-WConSC.2015.7284129.
[13] Zager, L. A., & Verghese, G. C. (2008). Graph similarity scoring and matching. Applied Mathematics Letters, Vol. 21, Issue 1, pages 86-94.
CITE THIS NOTEBOOK
CITE THIS NOTEBOOK
GPT3 .5 Syntactic structure with temperature variation using graph and parse-tree similarity
by Tianyi Evans Gu
Wolfram Community, STAFF PICKS, July 13, 2023
https://community.wolfram.com/groups/-/m/t/2964145
by Tianyi Evans Gu
Wolfram Community, STAFF PICKS, July 13, 2023
https://community.wolfram.com/groups/-/m/t/2964145