Wikimedia Foundation just announced Wikipedia's most popular articles of 2024. They published only number and no visualizations, which I intend to do below. Wikimedia Foundation claims that: “...people spent an estimated 2.4 billion hours—nearly 275,000 years!—reading English Wikipedia in 2024”.
The data from the article by Wikimedia Foundation
The data from the article by Wikimedia Foundation
This is main article from the
But the most updated data can be found from here (I also will need 2023 data):
We start by importing the data from the article page with a nice helper function ImportWikipediaTables at the Wolfram Function Repository:
In[]:=
wikiTop23=["Wikipedia:2023 Top 50 Report"];wikiTop24=["Wikipedia:2024 Top 50 Report"];
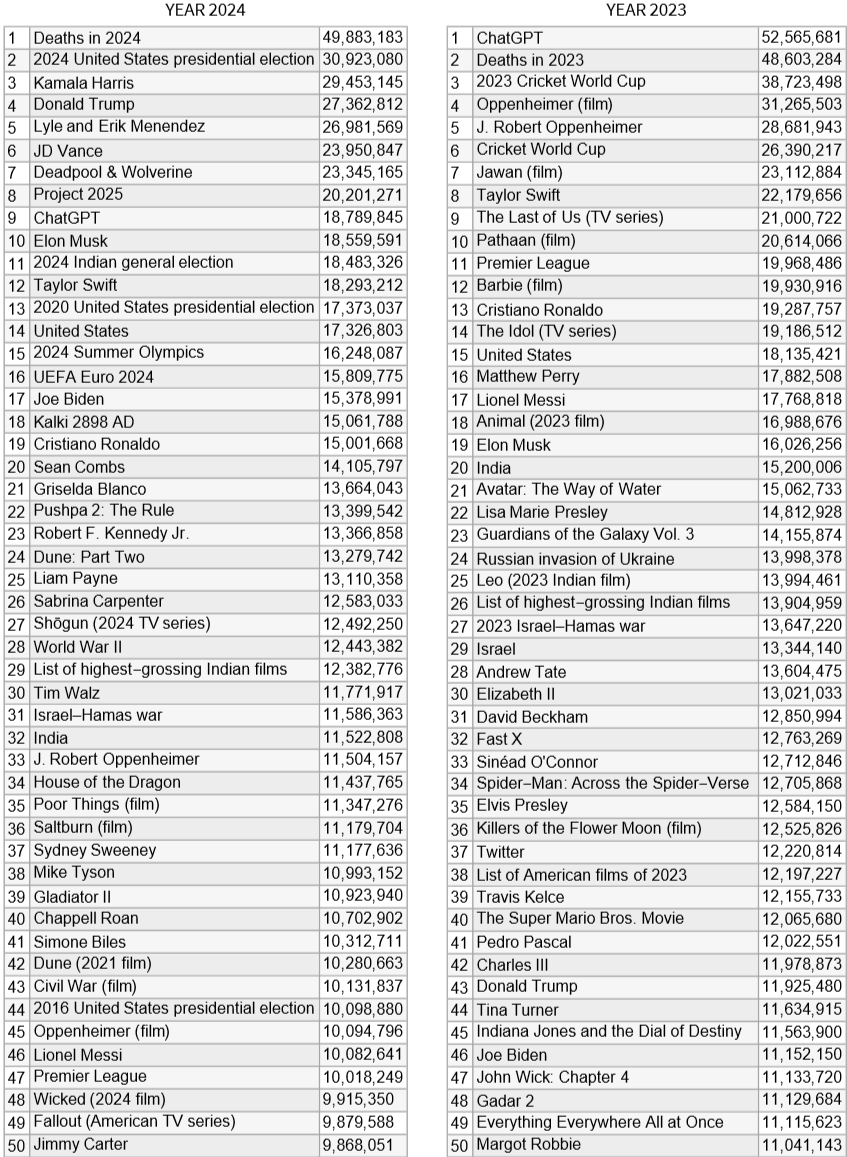
Here are the tables for 2024 and 2023 of page view data of the top 50 most popular articles:
RowMapThreadLabeled[#1[[1]][[2;;,{1,2,4}]],Frame->All],#2,Top&,{{wikiTop24,wikiTop23},{"YEAR 2024","YEAR 2023"}},Spacer[20]
Out[]=
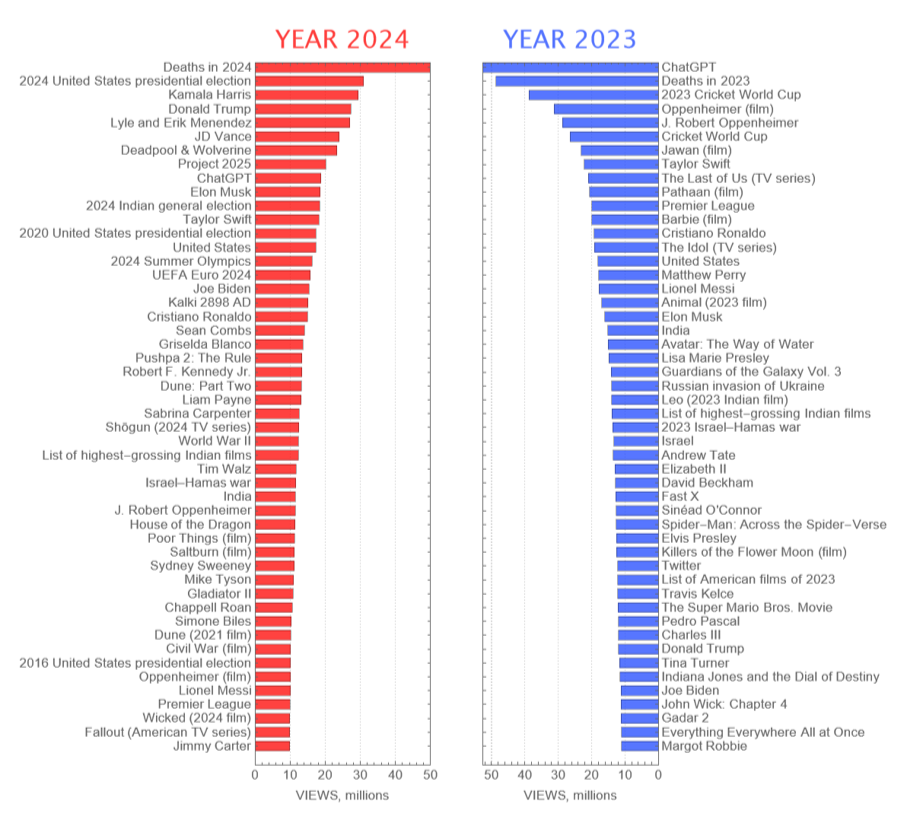
The following computes BarChart for each year separately:
bc24=BarChart[Reverse@N@#1,ChartLabels->Reverse@#2,BarOrigin->Left,PlotTheme"Detailed",AspectRatio4,ImageSize400,BaseStyle13,PlotRange->{{0,50},Automatic},PlotRangePadding->None,ChartStyle->,FrameLabel{None,"VIEWS, millions"},PlotLabel->Style["YEAR 2024",25,,FontFamily->"Copperplate"]]&@@{ToExpression/@StringDelete[wikiTop24[[1]][[2;;,4]],","]/10^6,wikiTop24[[1]][[2;;,2]]};

bc23=BarChart[Reverse@N@#1,ChartLabels->Reverse@#2,BarOrigin->Right,PlotTheme"Detailed",AspectRatio4,ImageSize400,BaseStyle13,PlotRangePadding->None,ChartStyle->,FrameLabel{None,"VIEWS, millions"},PlotLabel->Style["YEAR 2023",25,,FontFamily->"Copperplate"]]&@@{ToExpression/@StringDelete[wikiTop23[[1]][[2;;,4]],","]/10^6,wikiTop23[[1]][[2;;,2]]};
We plot now these charts side by side with GraphicsRow -- it is important as it puts both charts int the same Garpahics coordinate system:
In[]:=
GraphicsRow[{bc24,bc23},ImageSize->900,AspectRatio->.9]
Out[]=
It is easy to find which Wikipedia articles / pages are common between 2024 and 2023:
In[]:=
Intersection[StringDelete[Rest@wikiTop23[[1,All,2]]," "],StringDelete[Rest@wikiTop24[[1,All,2]]," "]]
Out[]=
{ChatGPT,CristianoRonaldo,DonaldTrump,ElonMusk,India,JoeBiden,J.RobertOppenheimer,LionelMessi,Listofhighest-grossingIndianfilms,Oppenheimer(film),PremierLeague,TaylorSwift,UnitedStates}
By right-clicking on the side-by-side chart I can get the coordinates of the points which I would like to connect indicating presence in both years:

With CMD+C or CTRL+C one can copy / paste those coordinates on Mac or WIN into the notebook:
coor={{{442.5`,-48.74`},{303.2`,-155.6`}},{{330.7`,-88.46`},{573.6`,-607.5`}},{{290.6`,-288.8`},{549.`,-208.3`}},{{302.3`,-168.7`},{560.6`,-288.6`}},{{278.6`,-461.9`},{562.6`,-302.2`}},{{291.2`,-261.9`},{576.5`,-648.4`}},{{279.2`,-475.4`},{520.5`,-101.7`}},{{274.`,-648.8`},{555.4`,-261.5`}},{{281.7`,-422.1`},{567.9`,-381.8`}},{{274.1`,-635.5`},{512.5`,-88.66`}},{{273.4`,-661.7`},{548.5`,-181.9`}},{{300.5`,-195.3`},{541.4`,-141.7`}},{{297.5`,-222.`},{555.`,-235.5`}}};
I should also select a nice choice of visually distinct colors:
color={,,,,,,,,,,,,};
I define a nice BSplineCurve that will connect the same article in different years based on the coordinates I obtained:
In[]:=
ClearAll[conn];conn[c_,p_]:=c,Opacity[.7],PointSize[.007],Point[p],Thickness[.002],BSplineCurve#1,(#1+#2)2-,,(#1+#2)2,(#1+#2)2+,,#2&@@p;
#2[[1]]-#1[[1]]
100
#2[[2]]-#1[[2]]
2
#2[[1]]-#1[[1]]
100
#2[[2]]-#1[[2]]
2
And the following builds the final visualization:
CITE THIS NOTEBOOK
CITE THIS NOTEBOOK
2024's top 50 most popular Wikipedia articles
by Vitaliy Kaurov
Wolfram Community, STAFF PICKS, December 31, 2024
https://community.wolfram.com/groups/-/m/t/3348209
by Vitaliy Kaurov
Wolfram Community, STAFF PICKS, December 31, 2024
https://community.wolfram.com/groups/-/m/t/3348209