Proposed new definition of centrality measure and centroids for geometric regions and graphs
with examples and numerical experiments.
with examples and numerical experiments.
Technical comments
Technical comments
- Cells with important functions and definitions run when the notebook starts, it may take some time.
- Cells, colored LightPink (and with tag #userRun) need to run manually.
- Some of them have additional comments
- Cells, colored LightPink (and with tag #userRun) need to run manually.
- Some of them have additional comments
Introduction
Introduction
Once I was asked, how to determine “the center” of annulus to be in the specified place:
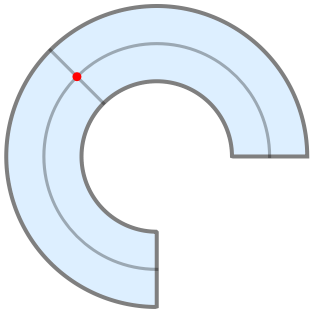
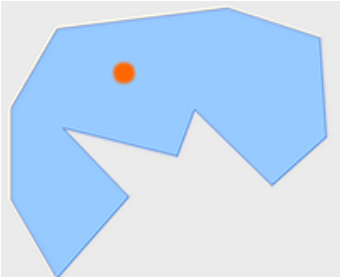
Obviously, this isn't mass center. Of course, we can use the middle radius and the concentric circle,but what to say about such a figure:Is it possible to give meaning to a centroid in a given location?In fact, there are many approaches to defining the center of a figure or measure of centrality.The most commonly used concepts are mean, equality etc. I conduct a small classification by placing it in this github.Here I'll try to propose a concept of centrality, which I have not met before.
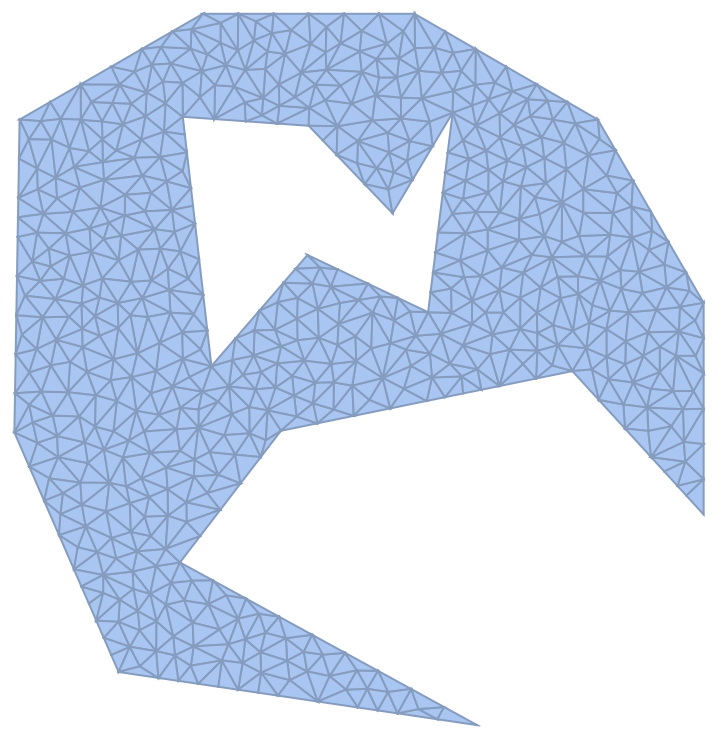
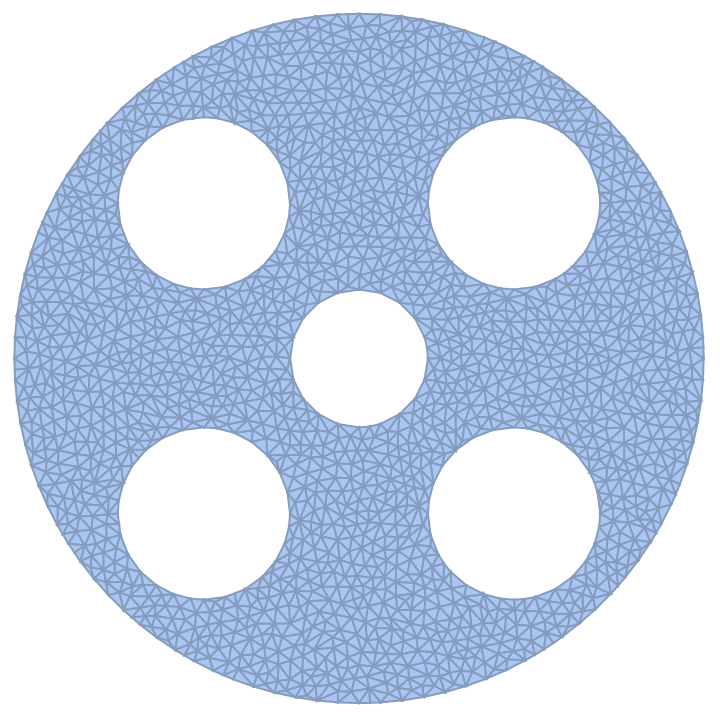
Samples of regions
Samples of regions
From the beginning it is obvious that we should use discretized versions of figures.
You can choose larger or smaller degree of discretization (MaxCellMeasure)
In[]:=
props={MaxCellMeasure{"Length"0.1},ImageSize->150};
samples={DiscretizeRegion[Disk[],props],DiscretizeRegion[Annulus[], props],DiscretizeRegion[Annulus[{0,0},{1/2,1},{0,3Pi/2}], props],DiscretizeRegion[Triangle[{{-0.9,-0.9},{0.2,-0.9},{0.8,0.85}}],props]};samples=Joinsamples,,
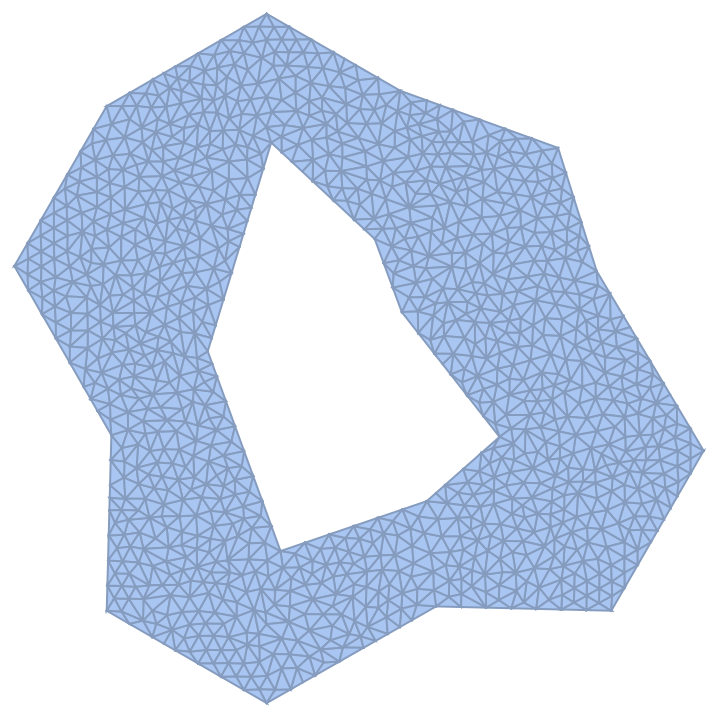
,
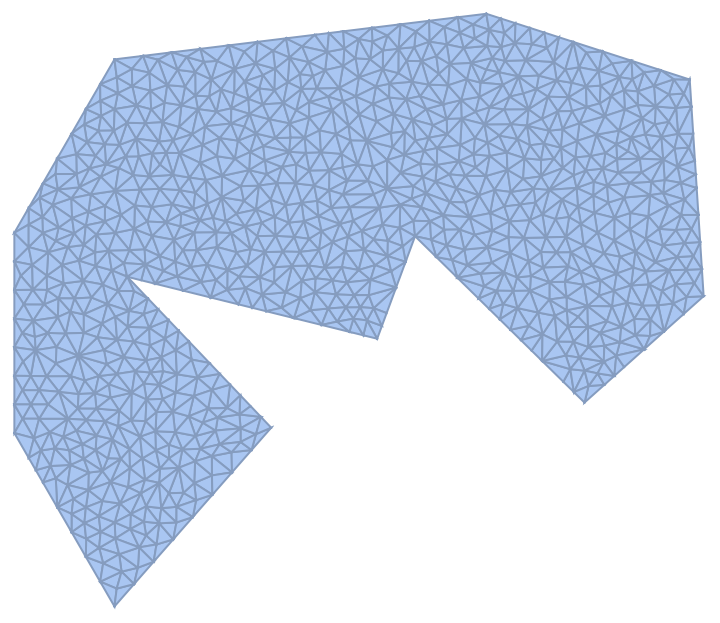
,
;
Select a region
Select a region
Here we should select any example and set it to global variable region
In[]:=
region=samples〚3〛
Out[]=

Preliminary requirements
Preliminary requirements
◼
◼
And more generally, centrality measure must be defined only with distances inside the figure.
◼
It should be determined for nonconvex figures, shapes with holes or with self-intersections.
◼
Should be expected generalizations for any dimensions and several centers.
Inner shortest path
Inner shortest path
Different metric (distances) can be used to determine centrality.
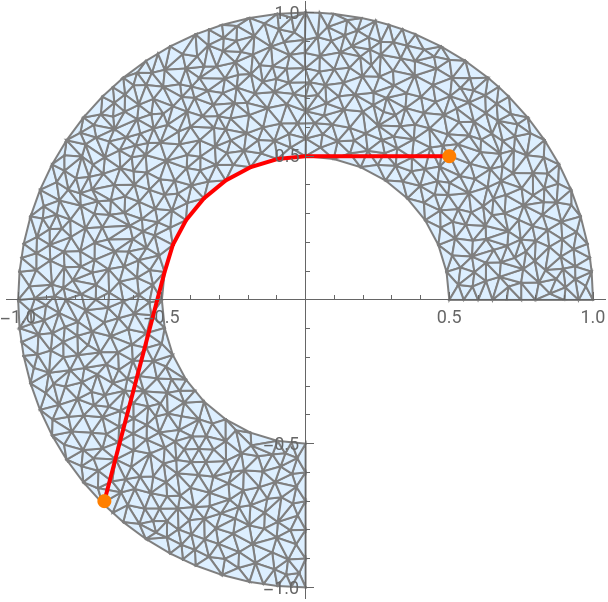
We’ll use basic EuclideanDistance, but for shortest paths strictly inside the figure,
because our center have to be medoid.
There is a cool resource function RegionFindShortestPath,
We’ll use basic EuclideanDistance, but for shortest paths strictly inside the figure,
because our center have to be medoid.
There is a cool resource function RegionFindShortestPath,
In[]:=
Clear[rfsp];rfsp=ResourceFunction["RegionFindShortestPath"];
In[]:=
(*Trydifferentpoints*)start={-0.7,-0.7};end={0.5,0.5};Graphics[{EdgeForm@Gray,FaceForm@LightBlue,region,Red,Thick,Line@rfsp[region,start,end],Orange,PointSize@Large,Point@{start,end}},Axes->True,ImageSize->100]
Out[]=
More theory about shortest paths.
Graph implementation
Graph implementation
We need to do massive calculations, so instead of using resource function let’s make directly
MeshConnectivityGraph
MeshConnectivityGraph
We shall be needing the following data of region:
- mesh points coordinates:
- mesh points coordinates:
In[]:=
coords=MeshCoordinates@region;size=Length@coords;
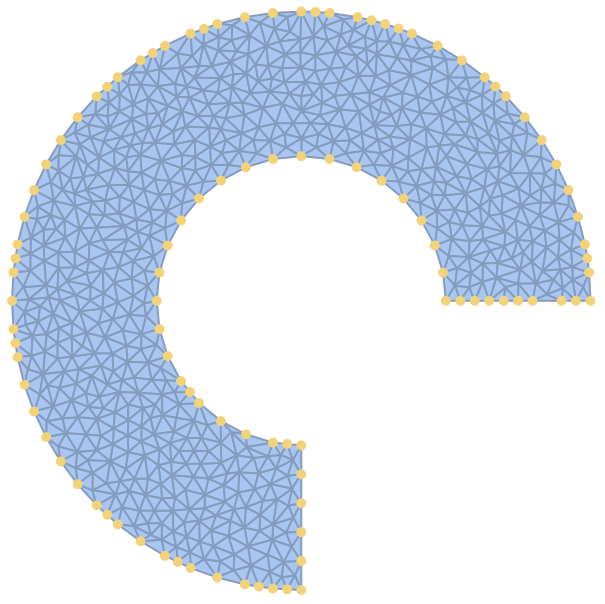
- boundary points identificators:
For planar graphs, the “outer face” property is not unique; you can draw the graph
so that any of the faces becomes the outer one, or you can even draw the graph such that it has different faces.
So we use RegionBoundary.
For planar graphs, the “outer face” property is not unique; you can draw the graph
so that any of the faces becomes the outer one, or you can even draw the graph such that it has different faces.
So we use RegionBoundary.
In[]:=
(*Boundary of region identification*)Clear[boundaryVerts];boundaryVerts[mesh_,coords_]:= With[{bnd=MeshCoordinates@RegionBoundary@mesh}, Flatten[Position[coords,#]&/@bnd,2]]; bound=boundaryVerts[region,coords]; HighlightMesh[region,{0,bound},ImageSize->120]
Out[]=
Now prepare mesh connectivity graph:
Observations have shown that the desired center position is obtained even for graph with a unit edge weight.
But to clarify the hole subject it is necessary to use a graph with edge weights as euclidean distances.
But to clarify the hole subject it is necessary to use a graph with edge weights as euclidean distances.
The most thing that we need from graph representation of a figure is
the distance matrix (all distances now inside a figure!)
the distance matrix (all distances now inside a figure!)
Different approaches to centrality
Different approaches to centrality
Make a pretty HighlightGraph
It takes 5-7 sec
Definitions
Definitions
Custom variance metric
Custom variance metric
This metric similar to some cluster quality metrics like the Davies-Boulding index and the Dunn index.
It is volatile and susceptible to outliers, but looks like very suitable as geometrical centrality measure.
It is volatile and susceptible to outliers, but looks like very suitable as geometrical centrality measure.
Custom centrality measure
Custom centrality measure
Let ℛ - arbitrary set of points in metric space, for which (any suitable way)
its boundary ∂ℛ ⊂ ℛ is defined.
Let also inner path between points (inside ℛ) is defined.
Distance between points (p, q) than is length of inner shortest path between them.
If ℛ is specified as mesh coonectivity graph, then all these concepts are well defined.
So our centrality measure for point p∈ℛ is:
In words, this measure shows the equivalence of the position of the point relative to the boundary of figure.
Here is the code of definition. It returns an array of centrality values in the order of VertexList.
Examples
Examples
Let’s highlight our centrality measure for samples of regions (point size is proportional to measure).
It takes 7-10 sec
It takes 7-10 sec
Region “centrality” measure
Region “centrality” measure
Examples show that some regions have “monotonic” centrality and
single centroid (in the sense of this measure) could be defined.
single centroid (in the sense of this measure) could be defined.
Function return position of centroid in VertexList
For some regions, however, the notion of a single centroid is meaningless.
We can estimate centrality measure of a figure as the degree of increasing
bounding box of centrality area with decreasing its threshold:
We can estimate centrality measure of a figure as the degree of increasing
bounding box of centrality area with decreasing its threshold:
We can find a quantitative measure of the growth rate of centrality area
(it takes 2-3 sec):
(it takes 2-3 sec):
Possible generalizations
Possible generalizations
◼
Miltiple centroids
There are many approaches for generation evenly distributed centers over some region.
This value may be greater for one centroid than for any configuration of several.
Especially for high centrality figures. This is a topic for further research.
Especially for high centrality figures. This is a topic for further research.
◼
3D objects
All definitions and methods without change are generalized to sets of any dimension, the only question is to get a mesh connectivity graph. This is for the next implementation.
CITE THIS NOTEBOOK
CITE THIS NOTEBOOK
New unusual definitions of centrality measure and centroids for geometric regions and graphs
by Denis Ivanov
Wolfram Community, STAFF PICKS, January 12, 2024
https://community.wolfram.com/groups/-/m/t/3102334
by Denis Ivanov
Wolfram Community, STAFF PICKS, January 12, 2024
https://community.wolfram.com/groups/-/m/t/3102334