Large wildfires eventually come to a halt due to a lack of fuel, changing weather, human intervention, or pre-existing landscape features. We aim to identify which natural and artificial landscape features, like roads, rivers, and vegetation, have been most successful in constraining wildfires in California. We evaluated the proportion of burn perimeters occupied by road and river vector graphics and evaluated their effectiveness based on the number of morphological components into which the fires were divided. We found that larger fires are more likely bounded by roads rather than rivers due to the higher density of roads over larger areas. Coupled with an analysis of vegetation cover and topography, this work will lead to extensive recommendations on constraining fires and potentially a model to predict fire bounds.
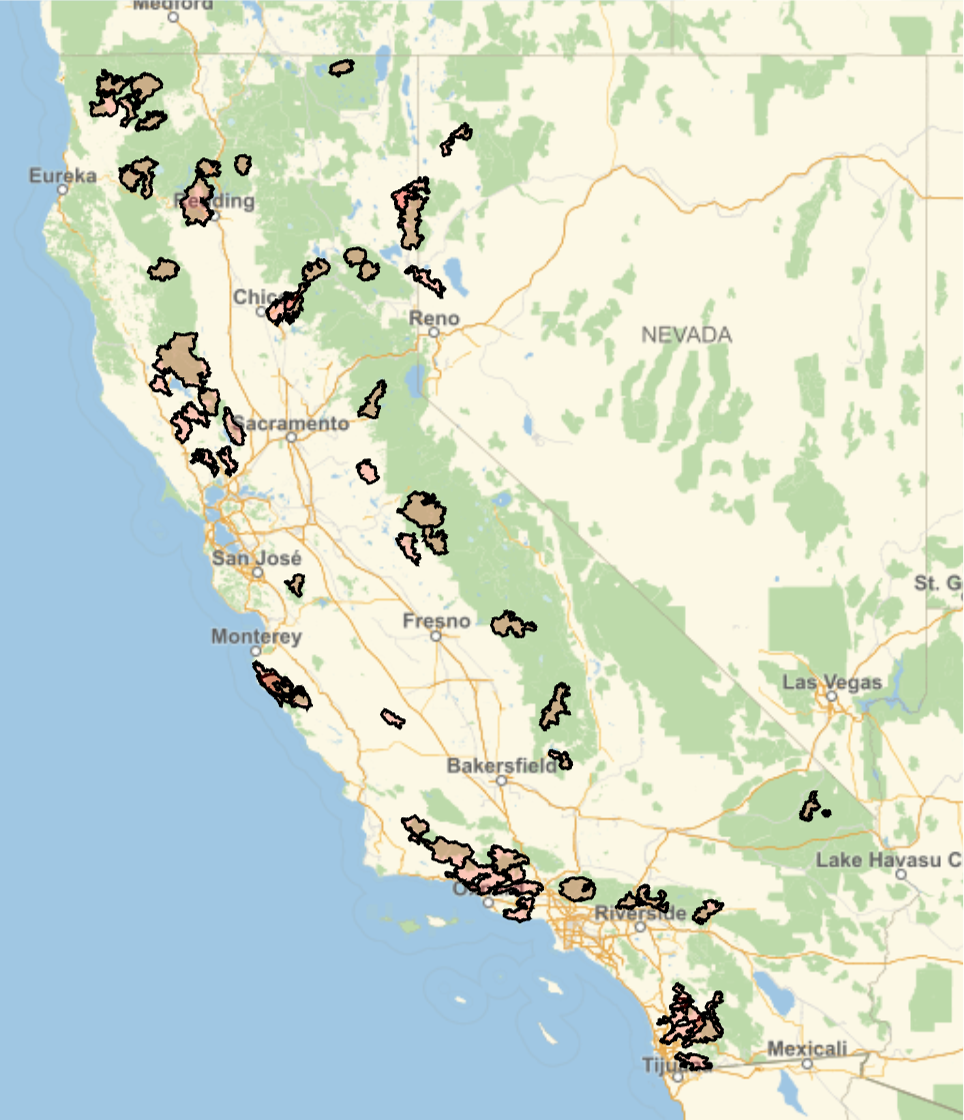
The largest 60 fires in California since 2000
In[]:=
GeoGraphics{EdgeForm[Black],FaceForm[Red],Tooltip[#3,#1<>", "<>DateString@#2]&@@@Query[;;60,{"IncidName","IgDate","Geometry"}][dsCa]},GeoRange->
Out[]=
Introduction
Introduction
Which landscape features are effective in constraining burn areas once a wildfire starts? As western North America once again suffers a record-breaking drought, an intense fire season is thought to ensue in the second half of 2021. The only semi-effective response to such fire forecasts is to manage vegetated lands with high amounts of fuel (plant biomass). Managing fuels means reducing the fuel loading to create fire breaks (stripes of barren land to limit the spread of the fire) or pruning lower tree branches to reduce the probability of fire crowning. We aim to improve these management strategies by identifying landscape features, natural or artificial, that are effective in limiting fire spread in the goal of emulating them.
The hypothesis of this project is that wildfire burn areas are constrained by different landscape elements such as fuel availability, natural fuel breaks such as water bodies and topography and artificial fuel breaks such as roads and forest clearing. The objectives are to 1) visualize different landscape layers simultaneously with burn areas for a high-level exploration of our hypothesis, 2) define quantitative metrics to relate landscape layers to burn areas, 3) and develop statistical and mechanistic modeling tools to describe burn area shape and distribution.
While the analysis in this project applies to wildfires anywhere on Earth, we decided to limit the geographic range to California. This is due to relatively better data accessibility and because of the severe fire season that will likely follow this year. For this community post, we focus on the vector elements of roads and rivers.
Google Drive link to downloaded necessary files: https://drive.google.com/drive/folders/1F-YaNiDfGl9UTN6DjT77FhBsobWyXl6e?usp=sharing
Data loading
Data loading
This section contains code to import data required to run this notebook. A larger companion notebook is uploaded that contains the details of data sources, download, import, wrangling, as well as the analysis here: [Insert Link Here].
The road and river vector data are from the Open Street Maps and the fire perimeter data are from the Monitoring Trends in Burn Severity (MTBS) website. More details in the full notebook referenced in the line above.
Imports rasterize data and statistics necessary for analysis of roads and rivers
In[]:=
{roadMapsByType,roadPolyRas,boundaryByType,morphCompNum}=Import[NotebookDirectory[]<>"communityPostVector.wxf"];
◼
roadMapsByTypes: rasterized maps of regions where the largest 400 fires occurred. For each fire, there is a list of 2 images, the first is the map of roads and the second is the map of rivers. This list is sorted in descending order of fire size.
◼
roadPolyRas: a list of fire polygons, for all fires, sorted in descending order of fire size.
◼
boundaryByType: A list where each element corresponds to a fire, for the largest 400 fires. Each element is a list of size two where the first element is the proportion of the fire perimeter bounded by roads and the second is the proportion bounded by rivers.
◼
morphCompNum: A list where each element corresponds to a fire, for the largest 400 fires. Each element is a list of size two where the first element is number of morphological component into which a fire is divided into by roads and the second is by rivers.
Import datasets containing fire details like ignition data, name, and polygons
In[]:=
dsCa=First@Import[NotebookDirectory[]<>"communityPostCaPolyDs.wxf"];
◼
dsCa: dataset of California wildfires where the “Geometry” Key corresponds to Polygon objects of GeoGridPosition objects.
Function definitions
Function definitions
Function to plot morphological components containing more than 100 pixels
Function to plot morphological components containing more than 100 pixels
In[]:=
plotMorphComp[fireRas_,map_]:=Module[{morphCompRanch=MorphologicalComponents[ImageSubtract[ColorNegate@ImageResize[fireRas,{300,300}],Dilation[map,DiskMatrix[2]]],0.9],selectComps},selectComps=Select[Tally[Flatten[morphCompRanch]],#[[2]]>100&][[All,1]];Colorize[morphCompRanch/.(x_Integer/;(!MemberQ[selectComps,x])->0),ImageSizeSmall]]
Variable effectiveness of roads and rivers as barriers
Variable effectiveness of roads and rivers as barriers
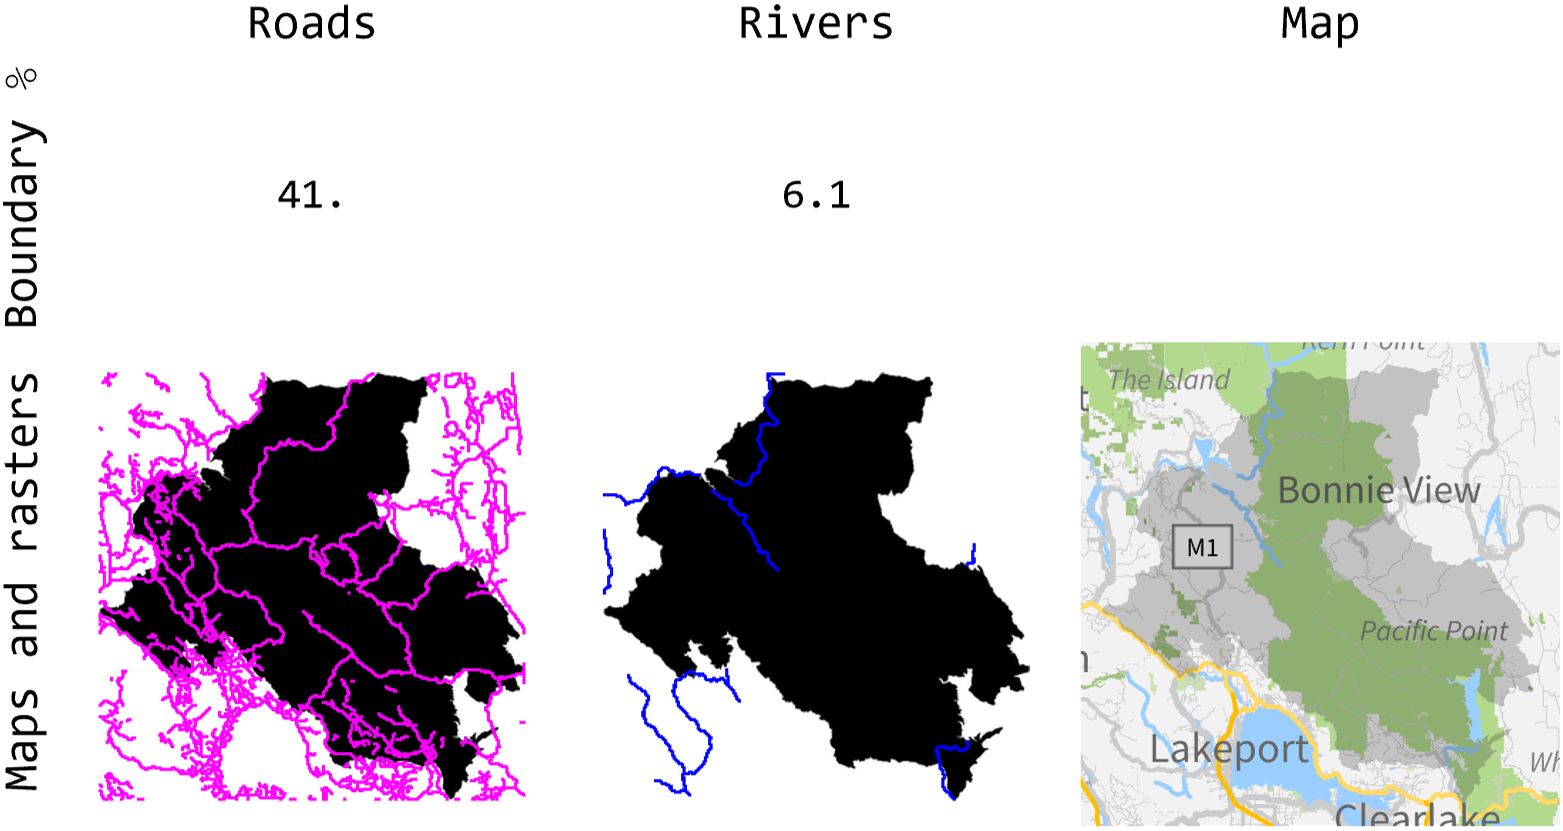
The effectiveness of roads and rivers as barriers to wildfire spread varies from fire to fire. From some of the most intense fires in the presence of wind, the creation and transport of embers by wind can spread a fire across wide fire breaks like roads and rivers. In that case, what one sees is similar to the left panel of the figure below where the Ranch fire spreads across multiple roads, colored in magenta. An equivalent view of the same phenomenon is that these roads divide the fire raster, colored in black, into multiple disconnected components which we will expand upon below.
Unlike roads, rivers are not primary features of that landscape as they are sparse and only border 6.1 % of the fire in the case of the Ranch fire according to the middle panel of the figure below (rivers in blue). From the vector map on the right panel, one can see that water bodies occasionally block fires. This sparsity in waterways and waterbodies compared to roads is a common feature of fire-prone landscapes and will affect some of the results below.
The Ranch fire of 2018: the presence of roads does not guarantee containment
Out[]=
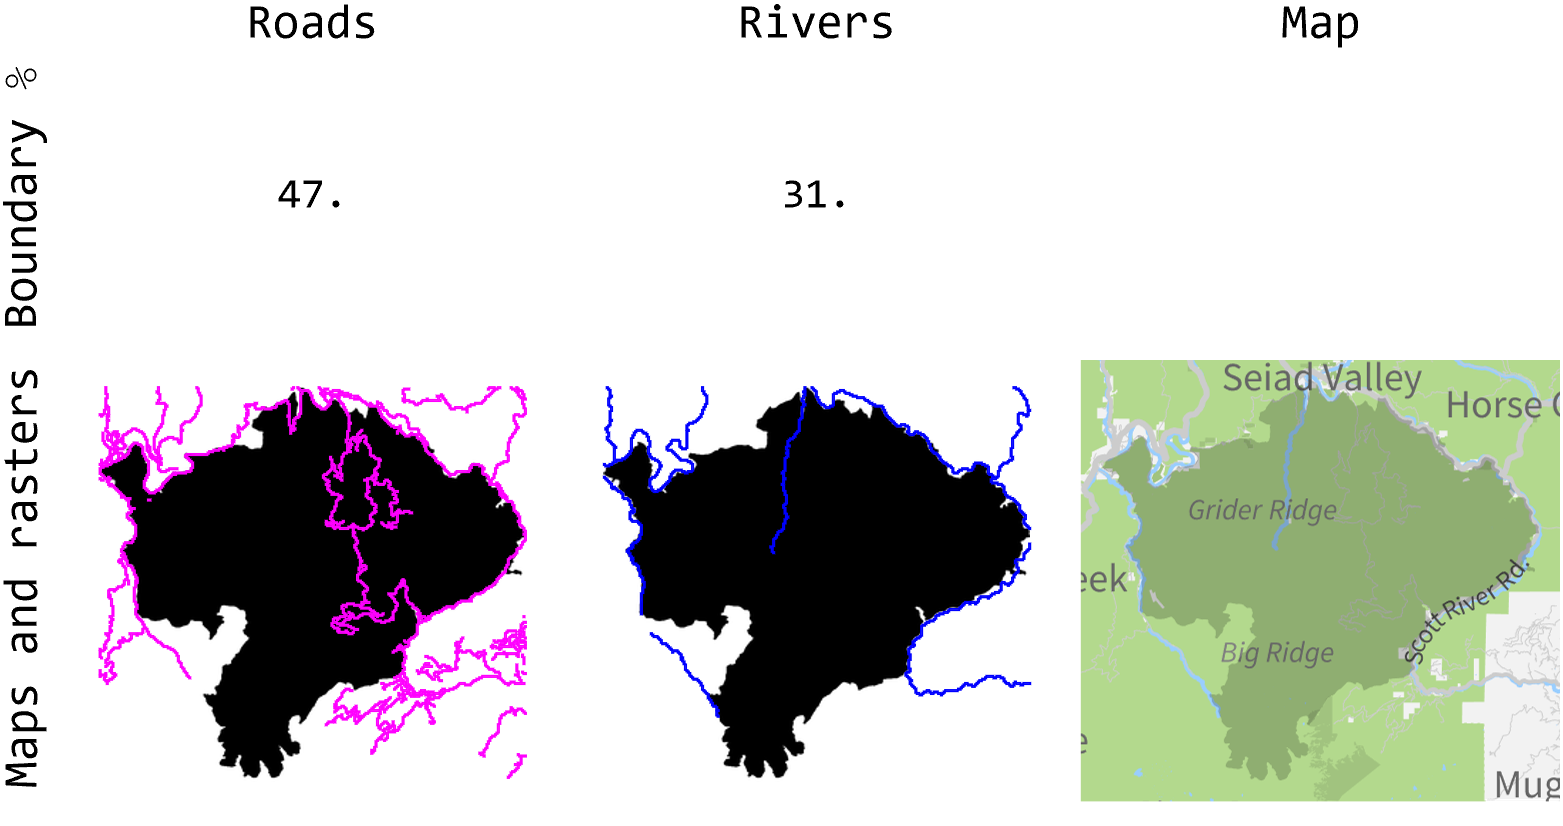
Roads are a more effective barrier in the case of the Happy Camp Complex according to the left panel in the figure below. This is due to roads only dividing the complex into 3 regions, indicating that the fire jumped across 2 roads at most only even though roads bordered 47% of the fire, more than the Ranch fire above. An important landscape feature around many fires is that roads and rivers are often co-located as seen by comparing the left and middle panels below. Observe how a signification portion of the magenta and blue lines are located around the same areas. This might confound the analysis of the effectiveness of roads versus rivers as fire barriers. But since road are many times more abundant than rivers, this effect is minimized.
The Happy Camp Complex of 2014: a case where roads and rivers are effective wildfire barriers
Out[]=
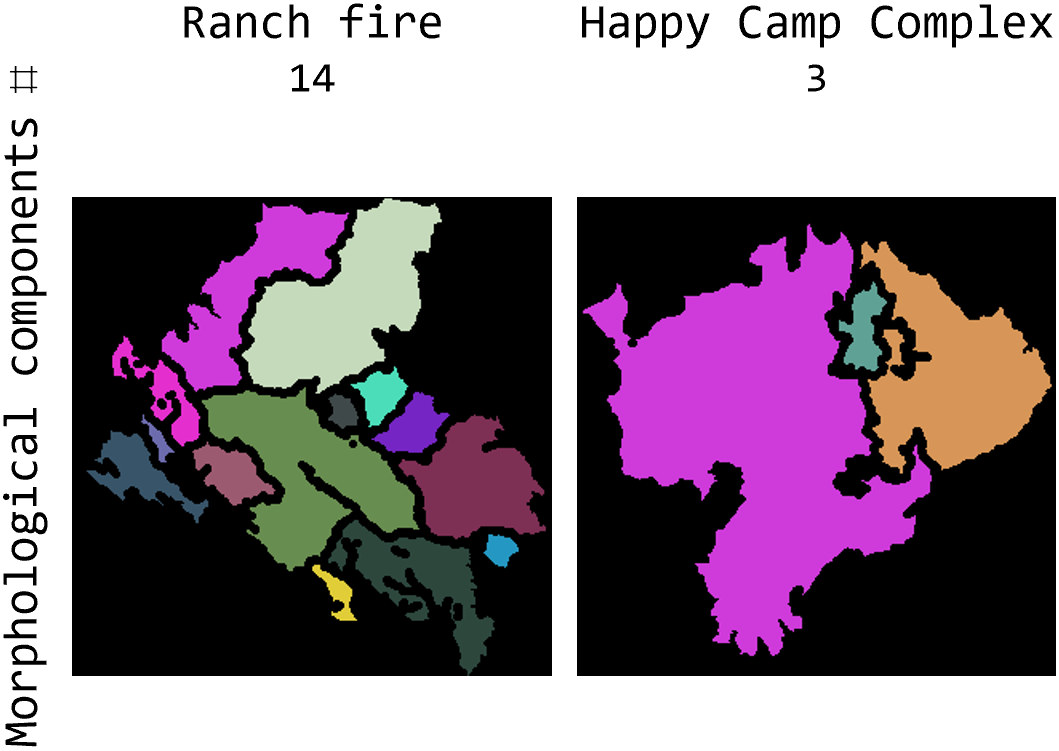
We can use the idea of splitting fire rasters into morphological components based on road and river vectors to quantify their effectiveness. The morphological components of a fire are subsets of the fire area that are split due to a road or river cutting through the fire area. For example, in the figure above, roads in magenta split the fire into 3 components but rivers in blue do not split it, so it stays as 1 component from a river point of view. When fires jump more often across roads or rivers, they are split into more morphological components. Thus, a smaller number of components indicates a more effective barrier given a certain boundary percentage. The figure below shows the same two example fires above but split into morphological components based on road vectors. The Ranch fire has 14 morphological components compared to the Happy Camp Complex’s 3. This result quantifies the observation we made above that roads are a more effective barrier to fire spread in case of the latter.
Roads splitting fire rasters into multiple morphological components: a measure of effectiveness
Out[]=
Statistics over the largest 400 fires in California since year 2000
Statistics over the largest 400 fires in California since year 2000
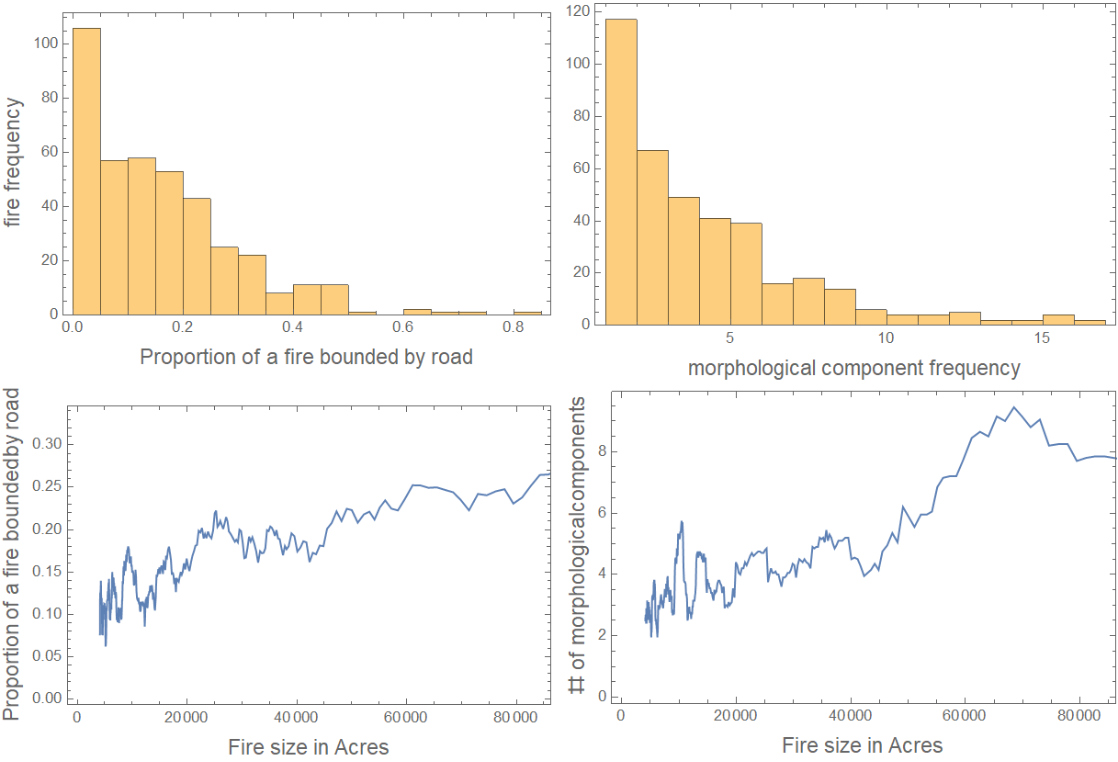
We now perform a statistical analysis of the fire boundaries for the largest 400 fires in California since 2000. In the figure below, we plot the histogram of the proportion of fires bounded by roads in the top-left panel. What we see in this histogram is that a decreasing number of fires have more road boundaries; an expected result. The majority of the fires have close to no roads at the boundary or inside. On the top-right is the histogram of the number of morphological components formed by the roads. A significant portion are split into 3 or more morphological components, but the majority has less than 5 components. In other words, most fires jump across less than 4 roads. The ListLinePlot at the bottom-left of the figure indicates that it is the largest fires that are the most bounded by roads. But this is not due to higher road effectiveness as a barrier. In fact, this is due to a higher density of roads overlying the burn area as indicated by the bottom-right panel. In other words, the larger the fire, the more roads it jumps across, and the more of its perimeter is bounded by roads.
Roads: Histograms and ListLinePlots of the proportion of fires bounded by roads and number of morphological components due to roads in relation to fire size
Out[]=
A significantly lower proportion of the fires encounter rivers as a boundary, compared to roads, as indicated by the histogram on the top-left subfigure below. The smaller proportion and number of morphological components is likely due to rivers being less numerous than roads on the landscape. Moreover, in contrast to roads, the proportion of a fire bounded by a river does not increase with fire size nor does the number of morphological components. The difference in these trends with size between roads and rivers are thought to be due to human-built roads being heterogeneously distributed over a landscape, with higher densities in and around cities. Rivers are more homogeneously distributed over the landscape.
Rivers: Histograms and ListLinePlots of the proportion of fires bounded by rivers and number of morphological components due to rivers in relation to fire size
By calculating the ratio of the proportion bounded by a road or river and the number of morphological components, we are able to evaluate which of roads or barriers are more effective fire breaks. The figure below shows that number to be around 5% for roads and 2% for rivers. In other words, for every road a fire jumps, another road constrains an additional 5% of its perimeters compared to 2% for rivers. Thus, for the same length of roads and rivers, we expect roads to be more effective in stopping the spread of the fire.
Roads are twice as effective at bounding fires
Concluding remarks
Concluding remarks
We have seen how artificial and natural landscape features constrain fire spread, but the degree of success depends on the specific fire. Metrics based on edge detection and extracting morphological components from rasterized maps of fire boundaries and vector elements were developed. We used these to evaluate the effectiveness of roads and rivers in stopping the spread of fire. We found that the largest fires are more likely to be constrained by roads due to higher road density. We also found that roads are more effective than rivers based on the fact that fires were more successful at jumping over rivers and continuing fire spread.
The full analysis notebook contains a Machine Learning-based analysis of vegetation cover and elevation in terms for fire containment. We will be building on this notebook to 1) evaluate whether California fires can truly be seen as either fuel-driven or wind-driven [1], 2) extend the analysis to all of the USA, 3) develop a statistical model to predict possible final burn areas after including the effect of weather and fuel moisture.
The full analysis notebook contains a Machine Learning-based analysis of vegetation cover and elevation in terms for fire containment. We will be building on this notebook to 1) evaluate whether California fires can truly be seen as either fuel-driven or wind-driven [1], 2) extend the analysis to all of the USA, 3) develop a statistical model to predict possible final burn areas after including the effect of weather and fuel moisture.
Keywords
Keywords
◼
Wildfires
◼
California
◼
Landscape
Acknowledgment
Acknowledgment
I want to thank Christopher Wolfram for being a supportive and responsive mentor throughout this process. I appreciate Stephen Wolfram’s guidance in crafting the direction of this project. I would also like to thank Mads Bahrami for inviting me to attend this Summer School. Many thanks to the TAs without whom I wouldn’t be able to complete this project in such a short time (especially Jesse Friedman, Silvia Hao, and Daniel Sanchez). I also greatly appreciate the support of my postdoc mentors Dr. Tirtha Banerjee and Dr. Lauren Lowman.
References
References
◼
[1] Keeley, Jon E., and Alexandra D. Syphard. “Twenty-first century California, USA, wildfires: fuel-dominated vs. wind-dominated fires.” Fire Ecology 15.1 (2019): 1-15.