In the United States, publicly funded education is intended to serve as a cornerstone of opportunity. Yet this promise remains unevenly delivered. Across more than 14,000 school districts, geography continues to shape the boundaries of access and achievement. While some students attend schools that consistently foster long-term success, others face chronic disadvantage rooted in place.
This project introduces the concept of No Child’s Land—regions where student performance, particularly in the wake of No Child Left Behind (2001), reflects the structural limitations of the systems meant to support them. These are areas where fiscal and demographic conditions constrain schools’ capacity to fulfill their educational mission, leaving students underserved and underprepared.
Using data from the U.S. Census Bureau, Department of Education, and Department of Defense, this analysis focuses on Missouri to identify school zones and regions where academic proficiency and workforce readiness persistently lag. Working in the Wolfram Language, I developed spatial visualizations that expose these patterns and align them with key demographic indicators. The result is a foundation for more targeted intervention and better-informed policy.
Completed as part of the Wolfram Summer School, this project serves as a proof of concept for future work. The next phase will extend the approach across additional states and years and incorporate fuzzy spatial modeling to better reflect the complexity and ambiguity of school boundaries in the era of school choice. Ultimately, this research maps the cartography of educational turbulence: places where the promise of opportunity is undermined by systemic instability—and where, for too many children, the educational map still reads: hic sunt dracones 🐉.
Initialization
Initialization
Paclet Import
Paclet Import
Function Definitions
Function Definitions
Data Import
Data Import
The data used in this project is stored locally on a private machine. Each source was individually processed by the author prior to the Wolfram Summer School, outside of the Mathematica environment. Some datasets—such as the Department of Education records—have since been removed from the Common Core of Data and EDFacts portals and are no longer publicly accessible. Additionally, due to data use restrictions, the AFQT datasets derived from FOIA reading room requests cannot be shared in their processed form—only the publicly accessible AFQT reading room interface may be referenced.
If a dataset remains publicly available, a link to the original (unprocessed) source is provided alongside the associated processed fields below. For questions or further information about data sources, please comment on this post or contact the author directly.
If a dataset remains publicly available, a link to the original (unprocessed) source is provided alongside the associated processed fields below. For questions or further information about data sources, please comment on this post or contact the author directly.
US Census Datasets & Shape Files
US Census Datasets & Shape Files
Department of Education Shape Files
Department of Education Shape Files
Department of Defense Reading Room Files
Department of Defense Reading Room Files
Department of Defense-Office of the Secretary of Defense Reading Room: ASVAB 2014 Sate Report Data for National Assessment-Missouri
In[]:=
afqt10=Import,"Tabular";afqt11=Import,"Tabular";afqt12=Import,"Tabular";
In[]:=
{MOvoronoiregionsData,MOvoronoiregionsPolygons}=importShapefile;
Project
Project
Cohort Overview: Following Students Through the System
Cohort Overview: Following Students Through the System
To understand the trajectory of academic performance and readiness, this project begins by organizing Missouri public school students into three longitudinal cohorts. Each cohort is defined by grade-level performance data aligned over time, approximating a typical academic progression from elementary through high school. Rather than viewing school performance as disconnected year-by-year snapshots, this cohort model attempts to trace how groups of students progress over multiple years within Missouri’s education system.
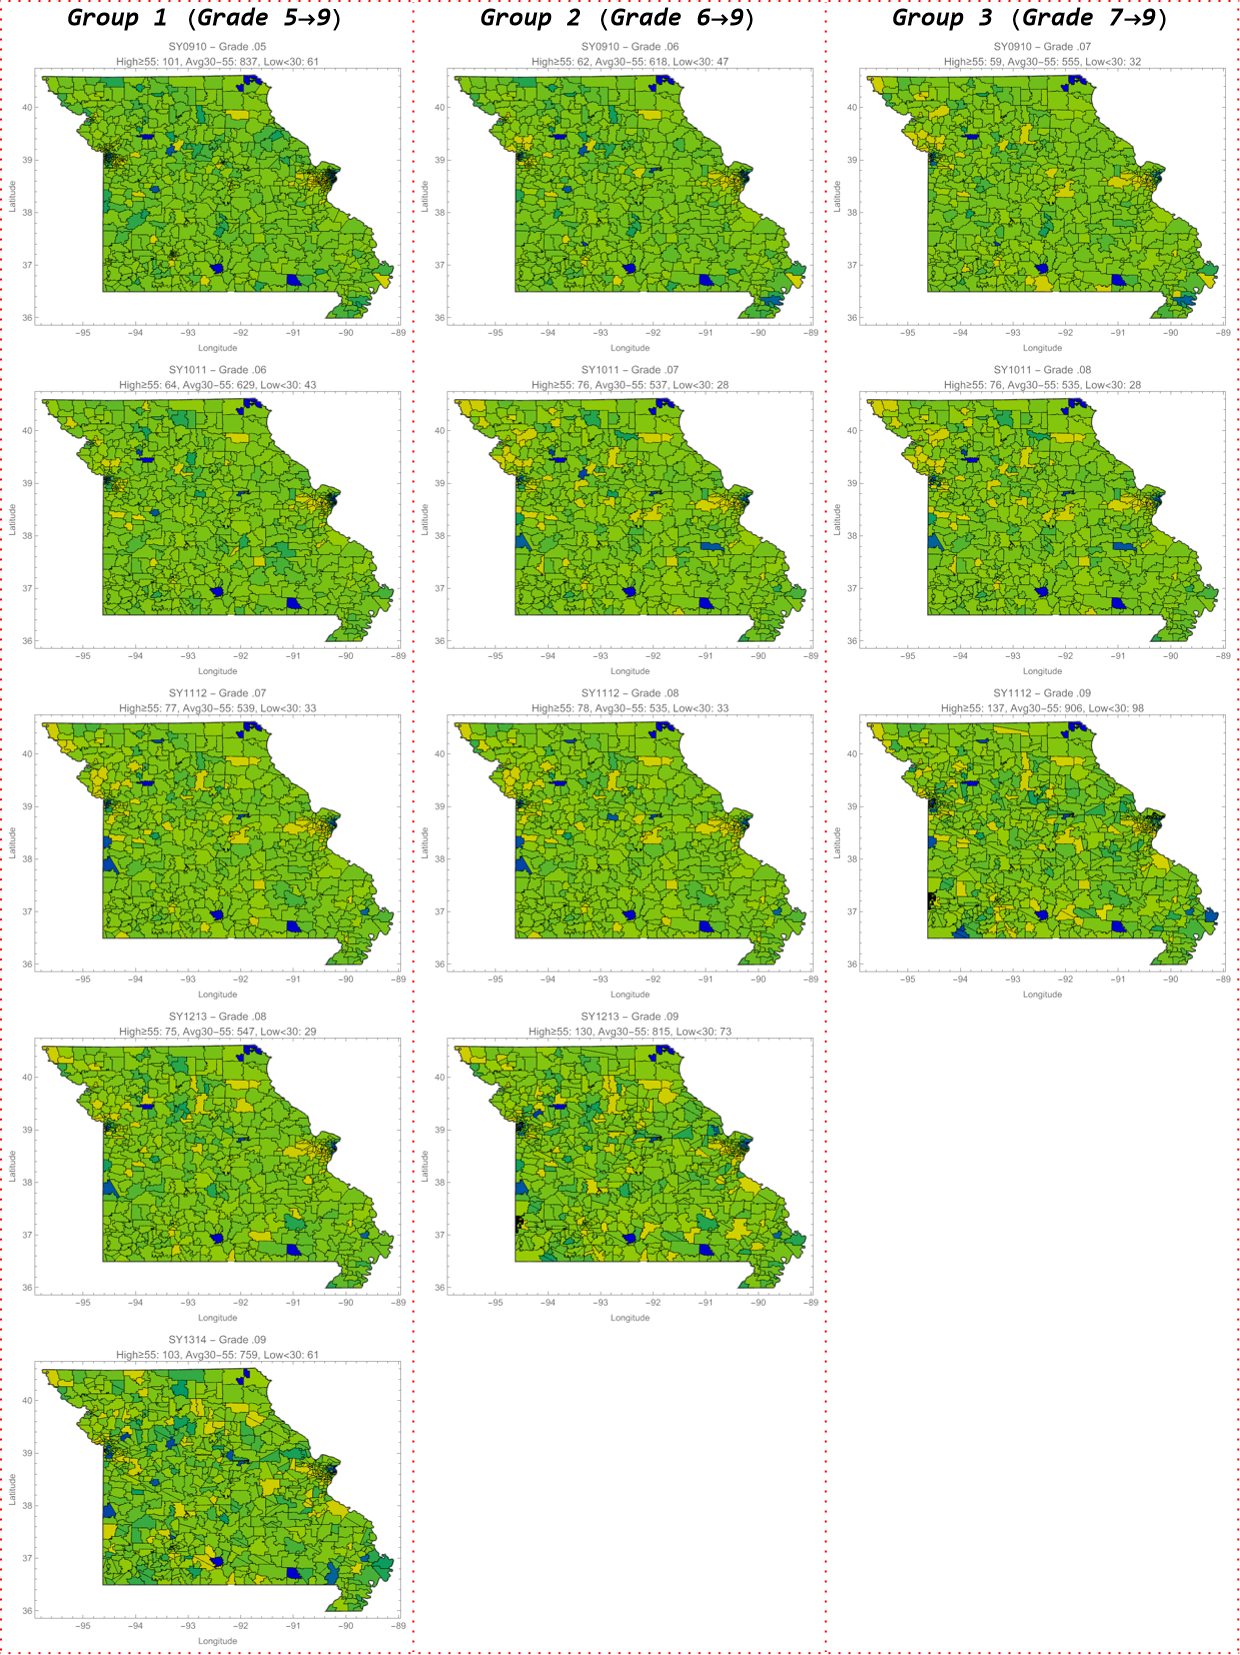
Cohort 1 (Class of 2017) includes students from Grade 5 through Grade 9, with performance data spanning five academic years. Cohort 2 (Class of 2016) includes students from Grade 6 through Grade 9, while Cohort 3 (Class of 2015) tracks students from Grade 7 through Grade 9. These groupings allow for cross-sectional and longitudinal comparison. As a result, the visualizations capture regional variations and persistent trends in student achievement. This approach is particularly valuable in Missouri, where school choice policies, magnet programs, and charter school options introduce fluidity into student progression patterns.
By focusing on cohort-based performance, this analysis sidesteps some of the challenges associated with comparing static institutional data across disjointed academic years. This also allows for extension through the incorporation of a post-9th grade metric-the Armed Forces Vocational Aptitude Battery taken by students in Grades 10-12. With a goal to identify both consistent underperformers and regions where students exhibit significant academic improvement across time to examine which districts and regions support workforce preparation and academic readiness.
The data on student performance comes from the U.S. Department of Education EdFacts data archive, anon-public source (as of Fall 2024) and the Missouri Department of Education. To create a unified value of performance for each school, every cohort’s grade-level scores were processed using fuzzy membership transformations, which allowed for consistent comparison across years, subjects (Math and English), and variations in reporting format. This continuous scoring method helps overcome limitations in how states typically report proficiency (e.g., “GE80,” “LT50,” or categorical ranges). By harmonizing this data into a common scale, it becomes possible to visualize performance as a landscape—one that can be interrogated spatially and compared against downstream workforce readiness indicators.
Academic Proficiency by Grade and Region
Academic Proficiency by Grade and Region
Using the fuzzy-transformed proficiency scores developed for each school-grade record, this section visualizes academic performance across Missouri. For each cohort, proficiency scores were mapped using Delaunay triangulation and Voronoi polygon assignment. This process created spatial regions associated with individual schools, using student performance as a pseudo-elevation value to generate visual “landscapes” of academic achievement. These visualizations provide more than static snapshots-they capture the shape and spatial distribution of academic performance across multiple grade levels and years.
Individual state maps were generated for each year of data (Grades 5 through 9, depending on the cohort). This reveals pronounced spatial disparities in outcomes. Yellow areas represent high-proficiency educational units and districts, while blue areas indicate low-proficiency educational units. In many cases, regions that begin with strong performance in early grades decline steadily over time, while others reflect persistent low performance across all years. Because these maps incorporate fuzzy membership values they allow for a more nuanced interpretation of variation, especially across regions with inconsistent or ambiguous reporting formats.
This approach is particularly effective given Missouri’s diverse educational geography. Rural districts often contain a single K-12 unit serving multiple towns, whereas urban areas host dense networks of neighborhood schools, magnet programs, and charter campuses. These structural differences produce distinct opportunity landscapes. In some places, high-proficiency schools are geographically isolated from lower-performing ones. In others, sharp variation occurs between schools only a few miles apart; underscoring the importance of localized spatial analysis.
By anchoring each school’s performance to both its geographic coordinates and grade level, these visualizations serve as building blocks for broader regional modeling. When viewed across time and cohorts, they begin to reveal educational trajectories—not only for individual students, but for the communities and systems that structure their access to opportunity.
Out[]=
AFQT/ASVAB Outcomes: Workforce Preparedness by Geography
AFQT/ASVAB Outcomes: Workforce Preparedness by Geography
While many assessments can be used to evaluate post-secondary readiness, including the ACT, PSAT/NMSQT, and SAT, these exams are designed primarily to measure college aptitude. To assess the broader impact of acquired learning and long-term academic development, this project incorporates a workforce-oriented outcome: the Armed Forces Qualification Test (AFQT). The AFQT is a composite score derived from the Mathematics and Reading/Writing portions of the Armed Services Vocational Aptitude Battery (ASVAB). As Selective Service registration is required for all male U.S. citizens, the AFQT is widely administered and provides a useful population-level indicator of readiness in the later stages of secondary education.
The AFQT is a norm-referenced, nationally standardized assessment administered to eligible students in Grades 10-12 since the 1960s. It remains a central tool used by the U.S. Department of Defense to determine military enlistment eligibility. Because of its consistency and broad scope, it allows for meaningful cross-regional comparisons of student preparedness that are less sensitive to local variation in curriculum or grading practices.
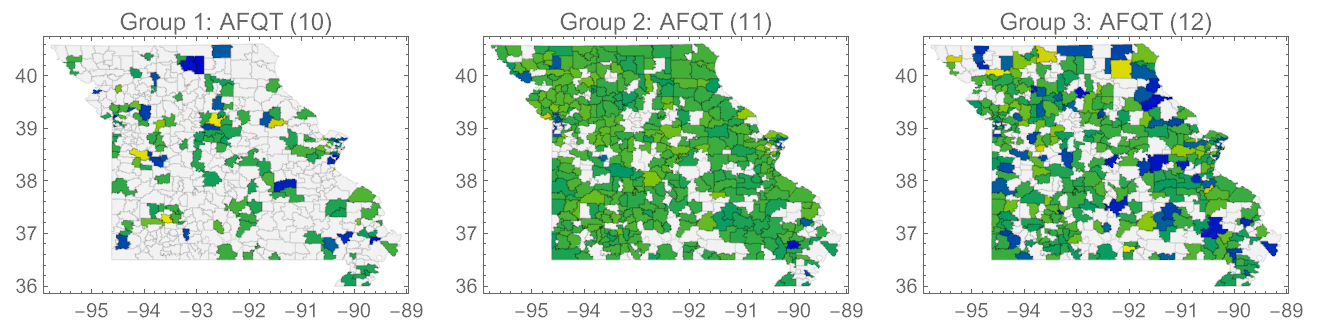
This project uses AFQT data from three successive cohorts, corresponding roughly to the high school graduating classes of 2015, 2016, and 2017. The data, reported at the school level, was spatially aligned with earlier grade-level proficiency patterns for each cohort. When overlaid on the Voronoi-based proficiency maps, AFQT results help contextualize how early academic performance translates into later outcomes. Schools with AFQT data were visualized as points layered over the cohort-specific proficiency regions, using the same blue-to-yellow color scale applied to student proficiency: blue indicating lower performance and yellow indicating higher performance. Unlike the cohort proficiency maps, which rely on fuzzy membership transformations to harmonize disparate reporting formats, the AFQT maps are based on raw average scores reported for each school. This direct use of school-level mean AFQT scores preserves the original distribution of outcomes and allows for comparison without interpolation or scaling.
Importantly, this approach maintains visual consistency across all maps by applying the same color range used for earlier grade-level data, enabling straightforward spatial comparison. Although all public high schools in Missouri participate in AFQT administration, they do not all administer the test in the same academic year. To account for this, schools are grouped into three cohorts: Group 1 (Grade 10 test-takers), Group 2 (Grade 11), and Group 3 (Grade 12). This breakdown reflects district-level variation in test scheduling and provides a more accurate basis for aligning AFQT outcomes with students’ prior academic histories. In this way, the AFQT becomes a longitudinal endpoint; helping to identify where school systems succeed against the odds and also where preparation breaks down.
Out[]=
Overview of K-12 Finance in Missouri
Overview of K-12 Finance in Missouri
In Missouri, public education funding comes from a blend of local, state, and federal sources, with per-pupil revenue serving as the most common unit for comparing district-level resources. Local funding—primarily generated through property taxes—tends to dominate in wealthier districts, while less affluent areas rely more heavily on state equalization formulas and federal aid. This uneven distribution creates persistent disparities in spending between districts, even when student needs are similar.
The Missouri Foundation Formula attempts to mitigate these gaps by allocating state funds based on student characteristics (e.g., special education, economic disadvantage), enrollment weights, and local tax effort. However, wide variation still exists, and schools serving similar populations can receive very different levels of support depending on district boundaries and property wealth. For this reason, per-pupil funding is both a policy lever and a diagnostic indicator; it shapes what schools can offer and reveals systemic inequities that accumulate over time.
Visualizing Per-Pupil Revenue (2009–2014)
Visualizing Per-Pupil Revenue (2009–2014)
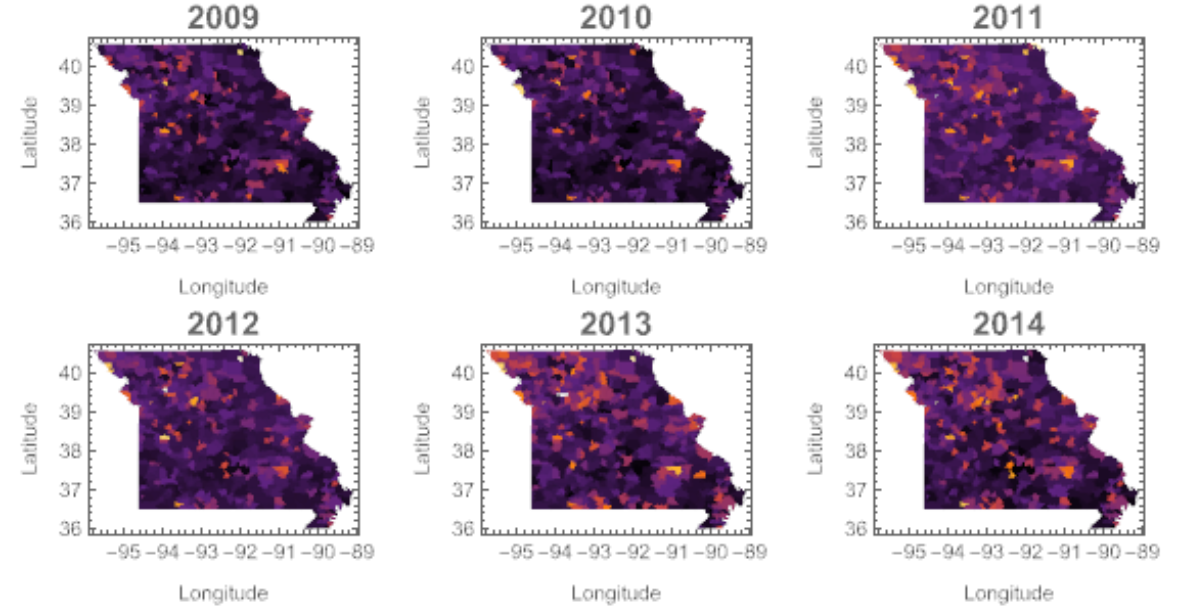
To assess these disparities across space and time, annual maps of Missouri school districts’ total revenue per pupil were generated for the years 2009 through 2014. Each year’s financial data was aligned with the appropriate geographic Shapefile and color-coded using a consistent gradient (“SunsetColors”). In these maps, darker colors represent lower per-pupil spending, while brighter colors indicate higher levels of funding.
No transformations or normalizations were applied between districts; however, all financial figures were standardized to 2014 dollars, preserving the real scale of differences in funding over time. By displaying the six years side-by-side, these maps provide a comparative view of how school funding evolved across Missouri’s educational landscape. Some districts appear chronically underfunded, while others show meaningful fluctuation in per-pupil revenue from year to year. This spatial–temporal grid helps illuminate structural patterns, persistent inequities, and potential anomalies in the allocation of educational resources statewide.
Out[]=
Mapping Long-Term Funding Disparities
Mapping Long-Term Funding Disparities
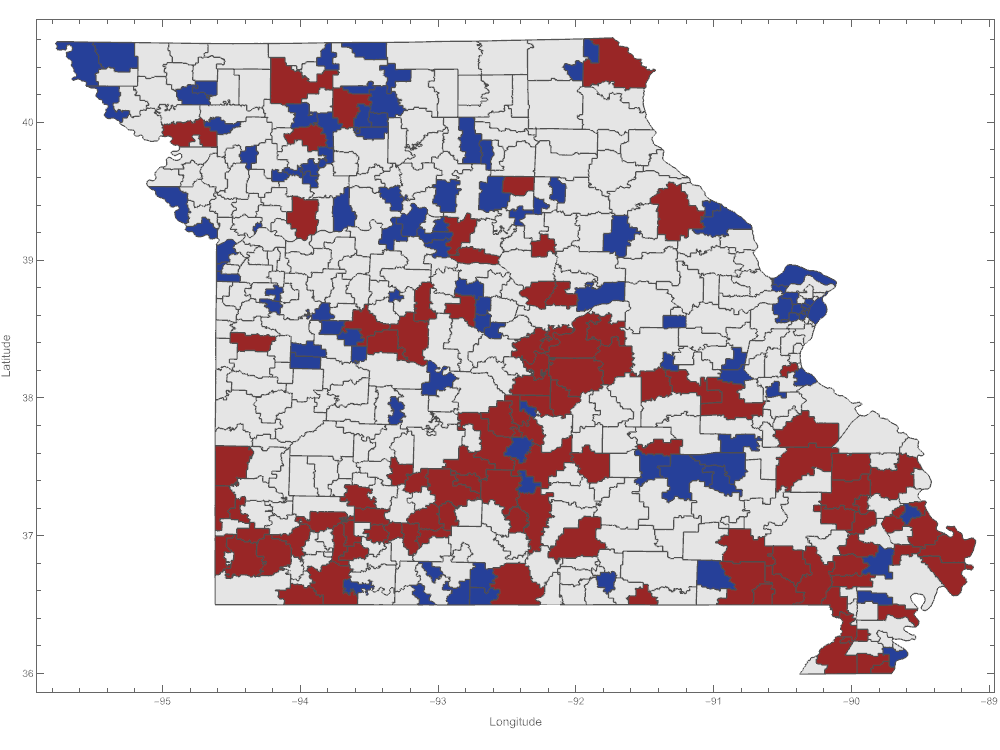
Beyond year-by-year comparisons, a multi-year summary map was created to highlight persistent disparities in per-pupil revenue across Missouri school districts. For each district with at least three years of available data between 2009 and 2014, the average total revenue per pupil was calculated. Districts were then ranked by these multi-year averages to identify consistent patterns of high and low-per pupil revenue collection.
In the resulting visualization, the lowest 20% of districts in average per-pupil funding are displayed in burgundy, signaling chronically underfunded systems. The highest 20% of districts appear in navy, indicating schools with sustained access to elevated financial resources. All other districts are shown in light gray. This visualization does not reflect any single year, but rather captures enduring disparities in how local, state, and federal revenues are collected and allocated across the state.
By focusing on multi-year averages instead of single-year variation, the map offers a more stable and policy-relevant view of Missouri’s school finance landscape. It is particularly useful for identifying systemically under-resourced districts that may require sustained investment, as well as well-funded outliers that can inform discussions about how educational revenue is accumulated, distributed, and experienced at the district level.
Out[]=
Census Block Analysis and Multi-Disadvantage Region Modeling
Census Block Analysis and Multi-Disadvantage Region Modeling
To better understand the environmental conditions that shape student outcomes, this section incorporates Census Block-level Demographic Data into the broader spatial framework of school performance. To begin with and to align data appropriately, each school district was broken down into a school-based assignment using a region growing function to develop a Voronoi polygon that aligned every site to a High School with students that took the ASVAB/AFQT. This shapefile formed the basis of all calculations to follow.
Subsequent analysis proceeds in stages, each increasing in computational complexity and analytical scope from localized catchment assignment to full fuzzy set-based disadvantage modeling.
Catchment-to-Block Alignment: Single-School Zone Alignment
Catchment-to-Block Alignment: Single-School Zone Alignment
Rather than using entire blocks, the centroids for each block polygon are tested for intersection with the school catchment area. This spatial filtering identifies the subset of blocks that fall within the school’s immediate geographic service zone. To ensure correct processing, a visualization is generated showing the selected school region (in blue) and the intersecting blocks (in red), providing a clean and intuitive view of the neighborhood context around a single educational unit. This stage serves as a proof-of-concept for block-level alignment, confirming that high-resolution Census geography can be associated with individual schools through centroid containment and spatial intersection logic.
Regional Aggregation: St. Louis City & County Block Assignment
Regional Aggregation: St. Louis City & County Block Assignment
Building on the single-catchment model, the second stage expands the analysis to the full set of eligible secondary schools (including public, private, and charter) in St. Louis City and County. Using boundary files representing the metropolitan area, the analysis filters the full set of statewide Voronoi regions to retain only those intersecting the urban region. This filtering is achieved through bounding box checks and explicit GEOS intersection tests against the unified St. Louis boundary polygon.
Each retained school catchment region is then matched to intersecting Census Blocks by testing both block boundaries and centroids for inclusion. This double-check ensures that spatial relationships are robust and that each school region is assigned only its immediately surrounding blocks. These block assignments are compiled into a dataset that includes counts of intersecting polygons and centroid matches for each school zone, providing a rich spatial summary of the St. Louis educational landscape.
Finally, a combined visualization is rendered showing all assigned blocks in red and their corresponding school catchment polygons in blue, overlaid with styled borders. This spatial summary confirms the effectiveness of the block-to-school mapping process at a regional scale and sets the stage for extending the model across the full state in the next stage of the analysis.
While it is known that charter and private schools pull from blocks beyond this bounding, this analysis was intended to show that block-identification could be completed. It is intended that a future analysis filters public schools from private and charter schools using a fuzzy overlay to extend the geographic catchment regions based on public enrollment data from the Common Core of Data to capture the spatial fuzziness inherent to unbounded attendance zones.
Linking Demographic Variables to School Zones in St. Louis
Linking Demographic Variables to School Zones in St. Louis
The second part of this stage connects high-resolution demographic data from the American Community Survey (ACS) to the block-defined school catchment zones constructed for St. Louis. Because most ACS variables are only available at the Block Group level, this analysis aggregates Census Block assignments to their parent Block Groups and then matches demographic variables accordingly.
For each school zone, demographic composition is estimated by aggregating ACS Block Group values across all blocks assigned to the zone. The analysis includes:
◼
Educational attainment: percent of households with no diploma, high school diploma or GED, some college, and at least a bachelor’s degree.
◼
Household income: broken into bands—under $20k, $20k-$40k, $40k-$60k, $60k-$125k, and above $125k.
◼
Mobility: percent of children aged 5-17 who have moved, either within Missouri or from outside the state.
◼
Household structure: rates of married-couple households, cohabiting families, and female-headed households without a spouse.
◼
Language fluency: share of households speaking English less than “very well.”
Each variable is computed using a zone-specific aggregation function, resulting in a dataset that captures the demographic characteristics of every catchment zone in the St. Louis region. All zones received complete data coverage across all five domains.
To visualize these patterns, six maps were created with each corresponding to a key demographic stressor:
1
.Bachelor’s Degree Rate - shows concentrations of highly educated households.
2
.Low-Income Households - tracks the prevalence of income below $40,000.
3
.High-Income Households - highlights wealth concentrations above $125,000.
4
.Household Mobility - reflects transience and residential instability.
5
.Limited English Proficiency - indicates linguistic barriers to access.
6
.Single-Parent Families - captures structural family disadvantage.
These maps are presented side-by-side, allowing comparison of overlapping challenges and demographic pressures across zones. Taken together, they provide a multidimensional view of disadvantage and lays the groundwork for the next stage of this analysis: statewide modeling of cumulative disadvantage.
Statewide Expansion of Cumulative Disadvantage Analysis
Statewide Expansion of Cumulative Disadvantage Analysis
Building on the block-level and demographic zone mapping established for St. Louis, the final stage of this analysis extends the model to cover the entire state of Missouri. Each school’s service area, constructed through proximity-based spatial partitioning, was matched to all intersecting Census Blocks. These matches relied on both polygonal intersection and centroid containment, ensuring that only blocks with a direct spatial relationship to each zone were included.
This process generated a comprehensive dataset of school-centered regions across Missouri, each linked to its intersecting Census Blocks and summarized by total block count, estimated households, and total population. These regions serve as the geographic foundation for integrating demographic data from the American Community Survey (ACS), using Block Group GEOIDs as linking keys.
As in the St. Louis analysis, five ACS datasets were integrated: educational attainment, household income, household structure, language proficiency, and geographic mobility. For each school region, Block Groups were mapped using the component blocks, and zone-level aggregates were calculated using custom averaging functions designed to capture the local demographic composition.
To manage computational scale, the statewide processing was conducted in batches. For each batch, more than 20 variables were computed per zone, including:
1
.Percent of households with at least a Bachelor’s degree
2
.Share of families earning under $40,000 and over $125,000
3
.Mobility rates among children aged 5–17
4
.Households with limited English proficiency
5
.Share of single-parent households, including breakdowns by family type
All variables were checked for completeness, with nearly every school zone receiving full coverage. The resulting dataset offers a fine-grained portrait of Missouri’s educational geography documenting the scale, composition, and structural context of each school’s surrounding community.
Six summary maps were generated and presented as a 2×3 grid. These visualizations reveal geographic clustering of cumulative disadvantage, offering a comparative lens on how socioeconomic and structural conditions align with school service areas across the state.
Six summary maps were generated and presented as a 2×3 grid. These visualizations reveal geographic clustering of cumulative disadvantage, offering a comparative lens on how socioeconomic and structural conditions align with school service areas across the state.
Modeling Multidimensional Disadvantage
Modeling Multidimensional Disadvantage
To move beyond single - variable comparisons, this stage of the project constructs a composite index of disadvantage for each school catchment zone in Missouri. The purpose is to identify areas where multiple risk factors coincide, revealing places that might not stand out when indicators are examined individually.
Using the statewide demographic dataset, five key indicators were selected to represent overlapping social and economic conditions that may influence educational environments :
Using the statewide demographic dataset, five key indicators were selected to represent overlapping social and economic conditions that may influence educational environments :
1
.Low Income - households earning less than $40, 000 per year
2
.Low Educational Attainment - defined as the inverse of the percentage of households with a bachelor’ s degree
3
.Single - Parent Households - households without a second caregiver present
4
.Limited English Proficiency - households where English is not spoken very well
5
.High Student Mobility - frequent residential moves among children ages 5 - 1
For each indicator, the 75th percentile was used as a threshold . A school zone with a value above this threshold for any variable received a score of 1 for that category . The scores were then summed across all five categories, creating a disadvantage score ranging from 0 (no elevated indicators) to 5 (present on all five).
Two types of maps were created :
Two types of maps were created :
◼
A categorical map, assigning colors to zones based on the number of elevated indicators . Zones with no flagged indicators are shown in gray, while zones with four or five are shown in red .
◼
A continuous map, assigning a weighted score that accounts for the magnitude of each variable, capturing both moderate and high levels of disadvantage.
These visualizations highlight areas where multiple demographic stressors overlap. Rather than isolating a single issue, this method offers a broader view of the conditions surrounding schools and the communities they serve.
By structuring these indicators into a composite model, this approach supports future efforts to identify regions with sustained challenges and inform targeted planning, resource allocation, or follow - up research.
By structuring these indicators into a composite model, this approach supports future efforts to identify regions with sustained challenges and inform targeted planning, resource allocation, or follow - up research.
Concluding Remarks
Concluding Remarks
Key Takeaways
Key Takeaways
This project offers a proof of concept for a new kind of educational spatial analysis; one that moves beyond district lines and school ratings to examine the conditions under which education is delivered. By linking detailed Census geography to custom-drawn school service areas, it becomes possible to detect systemic constraints that shape where learning can (and cannot) thrive.
Several key takeaways emerge:
◼
Some school zones align with structural advantage: families are stable, well-educated, and economically secure. In these areas, schools operate with the tailwinds of demographic support.
◼
Other zones exhibit persistent, overlapping stressors: low household income, low adult educational attainment, high mobility, limited English fluency, and single-parent households. These are the No Child’s Land-regions where schools are tasked with missions they cannot reasonably fulfill under current conditions.
◼
Risk clusters spatially. Zones with multiple disadvantages often form geographic corridors of constraint. These patterns are rarely visible in single-variable maps but become apparent through composite scoring.
◼
Mapping disadvantage is not merely descriptive. It surfaces systemic blind spots—areas where the promise of opportunity has quietly eroded. In these places, a child’s educational map may as well read: hic sunt dracones “here be dragons”.
This framework creates a baseline for identifying the contours of educational vulnerability across the state—and invites future models that can more fully account for the spatial fluidity of modern schooling.
Next Steps: Mapping Fuzzy Boundaries and Fragile Futures
Next Steps: Mapping Fuzzy Boundaries and Fragile Futures
This project serves as a proof of concept for how spatial decision analysis can be enriched through partial membership and fuzzy transformation, even before introducing a fully fuzzified spatial model. Across Missouri, grade-level proficiency, school finance, workforce readiness, and demographic risk are revealed not as isolated outcomes, but as elements of evolving spatial systems shaped by geography and policy.
However, the current model assumes school zones are crisp boundaries. In reality, those borders have eroded—especially in urban areas with charter, magnet, and open-enrollment systems. Educational influence rarely stops at a line. Students cross districts, zones shift, and catchments blur. The next phase will reflect that complexity by integrating spatial fuzzy set theory and plateau algebra. Rather than assigning each Census Block to a single zone, the model will compute degrees of affiliation—for example, 80% tied to one school, 20% to another. This better captures real-world enrollment patterns and institutional reach. These fuzzy regions will be paired with demographic and performance data to generate continuous surfaces of disadvantage, showing not just where challenges exist but how they spread through proximity, instability, and systemic constraint. This supports more transparent and realistic decisions about closures, investments, and boundary redrawing.
However, the current model assumes school zones are crisp boundaries. In reality, those borders have eroded—especially in urban areas with charter, magnet, and open-enrollment systems. Educational influence rarely stops at a line. Students cross districts, zones shift, and catchments blur. The next phase will reflect that complexity by integrating spatial fuzzy set theory and plateau algebra. Rather than assigning each Census Block to a single zone, the model will compute degrees of affiliation—for example, 80% tied to one school, 20% to another. This better captures real-world enrollment patterns and institutional reach. These fuzzy regions will be paired with demographic and performance data to generate continuous surfaces of disadvantage, showing not just where challenges exist but how they spread through proximity, instability, and systemic constraint. This supports more transparent and realistic decisions about closures, investments, and boundary redrawing.
This approach directly advances my broader methodological goal: a spatiotemporal multi-objective decision model (sfMODM) that incorporates fuzzy logic and regionalized spatial reasoning. While this project applied fuzzy logic only to performance data, future work will extend fuzziness to the geography itself: defining zones of influence based on enrollment flows, distance decay, and shared demographic pressures.
What this phase established is a reproducible scaffold using Voronoi-based models and weighted regional analysis, capable of identifying scaling student opportunity zones, outcomes, and system constraints across time. What comes next is more honest: a model of schools and zones that reflects the partial, overlapping, and messy reality students experience.
If this project helped chart the dragons, the next will map their domain. In doing so, we gain a clearer understanding of where opportunity breaks down and where new futures might still be built.
Acknowledgments
Acknowledgments
Thank you to the following Wolfram Mentors, Advisors, and TA’s:
Bowen Ping, Phileas Dazeley-Gaist, Christopher Wolfram, John McNally, Paul Abbott
Bowen Ping, Phileas Dazeley-Gaist, Christopher Wolfram, John McNally, Paul Abbott
References
References
1
.A.C. Carniel and M. Schneider (2018), “Spatial Plateau Algebra: An Executable Type System for Fuzzy Spatial Data Types,” 2018 IEEE International Conference on Fuzzy Systems (FUZZ-IEEE). https://doi.org/10.1109/FUZZ-IEEE.2018.8491565.
2
.A.C. Carniel and M. Schneider (2019), “A Systematic Approach to Creating Fuzzy Region Objects from Real Spatial Data Sets,” 2019 IEEE International Conference on Fuzzy Systems (FUZZ-IEEE). https://doi.org/10.1109/FUZZ-IEEE.2019.8858878.
3
.A.C. Carniel and M. Schneider (2021), “A Survey of Fuzzy Approaches in Spatial Data Science,” 2021 IEEE International Conference on Fuzzy Systems (FUZZ-IEEE). https://doi.org/10.1109/FUZZ45933.2021.9494437.
4
.R. Chetty et al. (2014), “Where Is the Land of Opportunity? The Geography of Intergenerational Mobility in the United States,” The Quarterly Journal of Economics. https://doi.org/10.1093/qje/qju022.
5
.D. Delaney (2011), The Spatial, the Legal and the Pragmatics of World-Making: Nomospheric Investigations. Routledge.
6
.M. Schneider (2014), “Spatial Plateau Algebra for Implementing Fuzzy Spatial Objects in Databases and GIS: Spatial Plateau Data Types and Operations,” Applied Soft Computing. https://doi.org/10.1016/j.asoc.2013.11.021.
7
.National Center for Education Statistics (2008-2014), Common Core of Data and School District Boundary Shapefiles. https://ies.ed.gov/use-work/data-tools.
8
.U.S. Census Bureau (20010-2015), American Community Survey and TIGER/Line Shapefiles. https://www.census.gov/programs-surveys/acs/.
9
.U.S. Census Bureau (various years), Annual Survey of School System Finances. https://www.census.gov/programs-surveys/school-finances.html.
10
.U.S. Department of Education (2009–2019), Proficiency Reports and AYP Assessment Data. https://ed.gov
11
.U.S. Department of Defense – Office of the Secretary of Defense (2014), “AFQT – Armed Forces Qualification Test (Missouri Data),” FOIA Electronic Reading Room. https://www.esd.whs.mil/Records-Declass/FOIA/Reading-Room/Reading-Room-List_2/Statistical_Data/.
Cite This Notebook
Cite This Notebook
“No Child’s Land: Where Opportunity Falls Off the Map ”by Robyn Gausman-Burnett, Wolfram Community, July 9, 2025