Inspired by OpenAI accusing DeepSeek of distilling its models, this work investigates the mechanics of Large Language Model (LLM) distillation attacks by analyzing how attackers systematically extract underlying reasoning capabilities from frontier models. By systematically analyzing API responses this notebook exposes extraction footprints such as predictable inter-query intervals and elevated reasoning marker frequencies. At the end it shows how timing-based defense mechanisms can expose automated harvesting.
In the GitHub repository you can find python code used to create and organise prompts data file divided into 5 categories: abstract (280), code_simple (280), commonsense (280), logic_chain (380), and math_basic (380) from gsm8k data and templates ranging between easy, medium, and hard.
Then I used this example prompt data to collect the 1600 responses from gpt-40 (1200 prompts) and gpt-4o-mini (400 prompts) to create the responses data file responses_openai.csv and make this analysis.
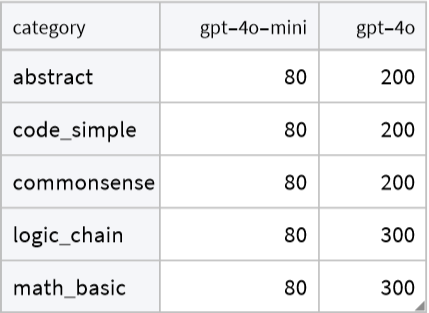
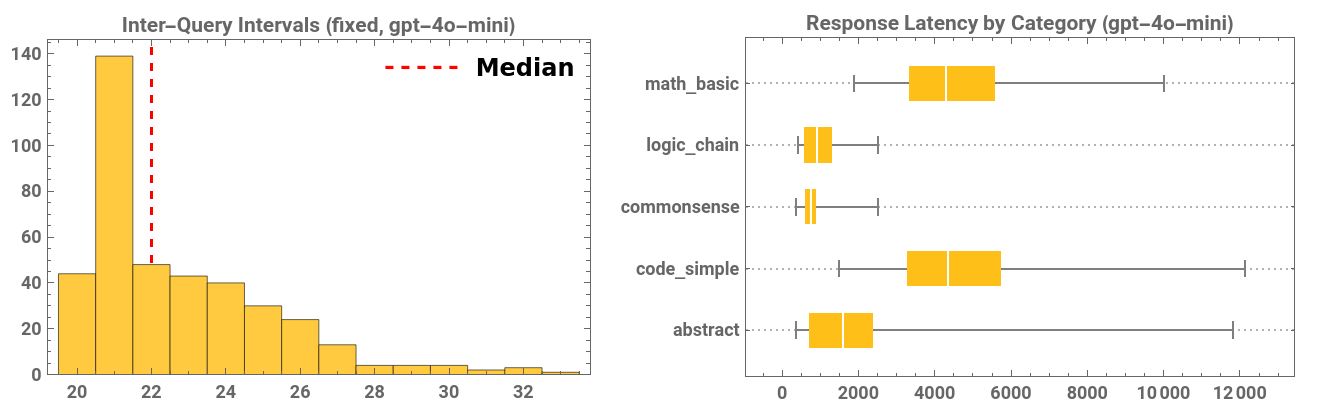
Here is how many responses I collected from each model. API calls intervals were fixed for gpt-4o-mini, while a uniform random between 10 and 25 for gpt-4o to reduce the collection time.
In[]:=
data=Import["\\\\wsl.localhost\\Ubuntu-22.04\\home\\ahmedco31\\llm-distillation-analysis\\data\\responses_combined.csv","Tabular"]
Out[]=
Tabular


In[]:=
responses=Normal[data[All,"response"]];wordCounts=Length[StringSplit[#]]&/@responses;
Extract categories and group the word counts by them
In[]:=
hist=HistogramwordCounts,;groupedData=GroupBy[Transpose[{Normal[data[All,"category"]],wordCounts}],First->Last];box=BoxWhiskerChartValues[groupedData],{"Outliers",{"MedianMarker",1,Directive[Thick,White]}},;GraphicsRow{hist,box},
Out[]=
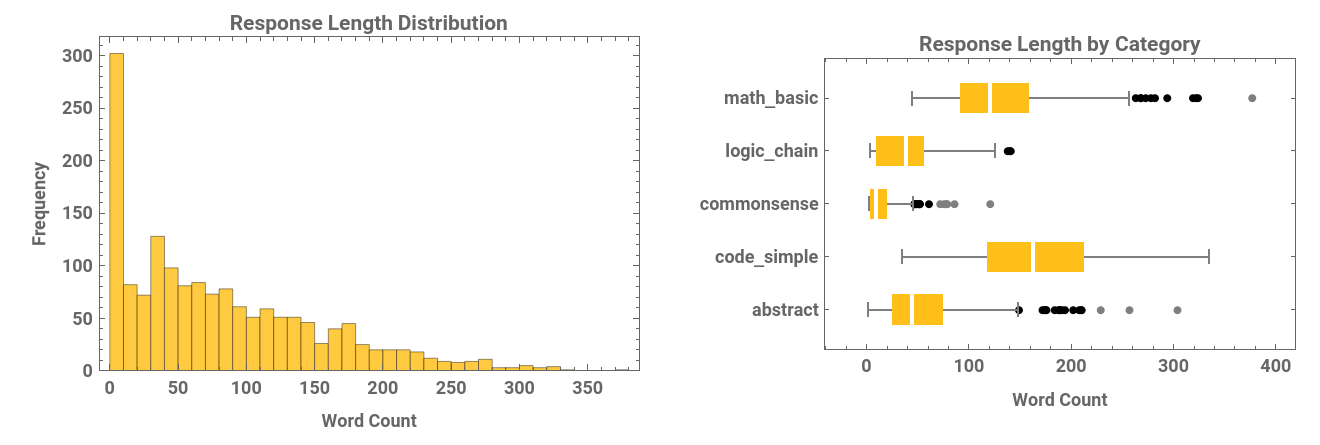
The heavily right-skewed distribution of response lengths is characteristic of a diverse query dataset aiming for broad domain coverage. Expected distillation behaviour. The boxplot shows how the word count is being distributed across the categories.
Reasoning pattern detection
Reasoning pattern detection
Distilling a model’s step-by-step reasoning process (Chain-of-Thought or CoT) is highly desirable because it allows an attacker to extract not just the final answer, but the underlying logic and problem-solving methodology of the target model. By tracking these markers, API providers can build anomaly detection systems to identify systematic queries designed to elicit these expensive reasoning chains, which strongly indicates a model extraction attack is occurring.
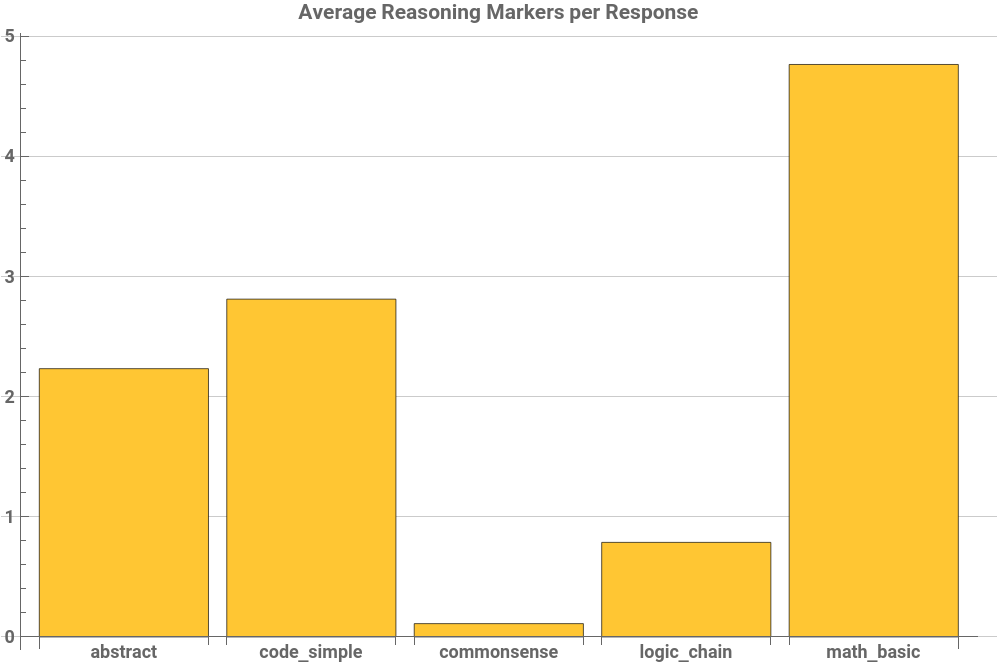
The bar chart below shows the average count of reasoning markers (like “first,” “then,” “therefore,” “step-by-step”) per response, grouped by category. High usage of reasoning markers in “math_basic”, “code_simple”, and “abstract” queries is shown.
Define markers and counting function
reasoningMarkers=;countMarkers[text_String]:=Total[StringCount[text,reasoningMarkers,IgnoreCase->True]];countMarkers[_]:=0;
Add the counts to the data
In[]:=
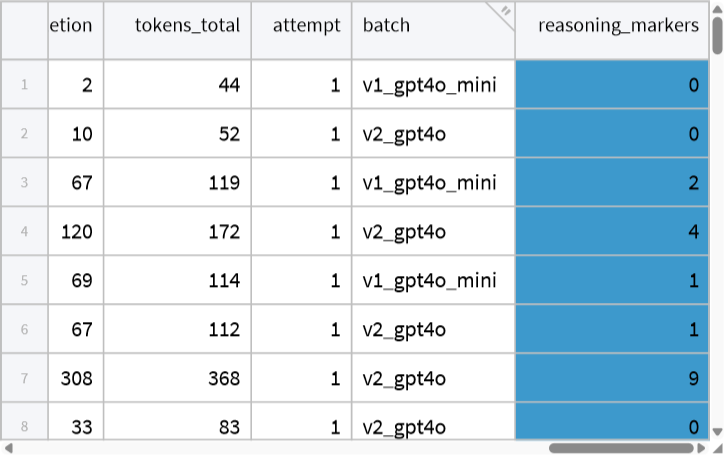
dataWithMarkers=InsertColumns[data,"reasoning_markers"->TabularColumn[countMarkers/@Normal[data[All,"response"]]]];Tabular[dataWithMarkers,Background-><|"ColumnRules"->{"reasoning_markers"->}|>,ImageSize->Medium]

Out[]=
In[]:=
reasoningByCategory=Query[GroupBy["category"],<|"mean"->(Mean),"std"->(If[Length[#]>1,StandardDeviation[#],0.]&),"count"->Length|>,"reasoning_markers"][dataWithMarkers];BarChartQuery[All,"mean"]@reasoningByCategory,
Out[]=
In[]:=
Dataset@reasoningByCategory
Out[]=

Query Pattern Analysis
Query Pattern Analysis
I understand now why attackers add a randomly-lengthed intervals between queries, to mimic human behaviour when interacting with AI and avoid detection. When I made a fixed 20 seconds interval between queries from gpt-4o-mini, the histogram of inter-query intervals gives me away immediately. The variation in server response latency creates the skew we see in the histogram. The boxplot shows that the API’s response latency is fundamentally tied to the category of the query, rather than the length of the query interval.
On the other side in gpt-4o data the intervals are randomised to bypass this giveaway and smoothed the histogram.
On the other side in gpt-4o data the intervals are randomised to bypass this giveaway and smoothed the histogram.
In[]:=
dataMini=Select[data,#model=="gpt-4o-mini"&];data4o=Select[data,#model=="gpt-4o"&];
In[]:=
Column@{Dimensions@data4o,Dimensions@dataMini}
Out[]=
{1200,17} |
{400,17} |
Extract timestamps, convert to seconds since 1900, sort, and calculate differences
In[]:=
intervals=Differences@Sort@N[AbsoluteTime/@Normal[dataMini[All,"timestamp"]]];
In[]:=
medianInterval=Median@intervals;
Latencies and their mean. Making sure we remove outliers that are due to connection error.
In[]:=
latencies=DeleteAnomalies@Transpose[{Normal[dataMini[All,"category"]],Normal[dataMini[All,"latency_ms"]]}];
In[]:=
meanLatency=Mean[N@latencies];
Histogram vis.
In[]:=
lHist=Histogramintervals,;
Latency by category: extract categories and group the latencies by category
In[]:=
latencyByCategory=GroupBy[latencies,First->Last];
In[]:=
lBox=BoxWhiskerChartValues[latencyByCategory],;
In[]:=
GraphicsRow[{lHist,lBox},ImageSize->660,Spacings->10]
Out[]=
In the case of randomised intervals in gpt-4o
Out[]=
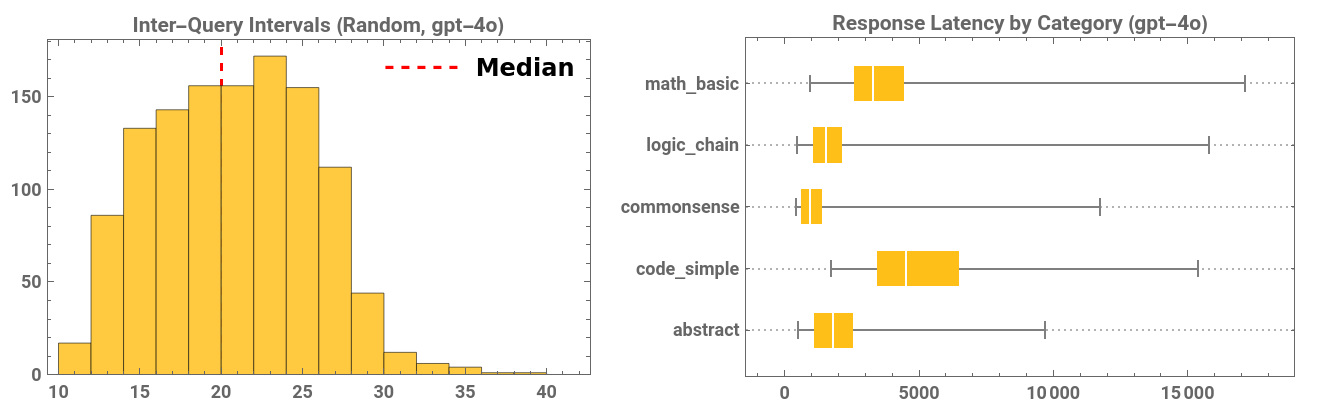
It is interesting though to see the (Response Latency by Category) has the same structure in both cases. Attackers have no control over how long it takes the API’s GPUs to process the queries.
Prompt embeddings clustering
Prompt embeddings clustering
When you send prompts to a Large Language Model (LLM), it converts those text inputs into “embeddings”—massive lists of numbers (often thousands of dimensions long) that represent the mathematical “meaning” of the text.
As humans we cannot comprehend 1,000-dimensional space, we use UMAP (Uniform Manifold Approximation and Projection). UMAP is a dimensionality reduction algorithm that squashes those thousands of dimensions down to just two (the X and Y axes you see here). Crucially, UMAP preserves local structure: if two prompts mean similar things or trigger similar internal model behavior, they will fall in the same cluster.
Let’s start by extracting relevant values from the data
These embedding may not be exactly what different LLMs use, but they are close enough to study.
UMAP Reduction
Creating tooltips
Group the points by category
The chart below proves that the LLM fundamentally treats these categories as entirely different computational tasks which forces the attackers to pick the categories they need knowledge for.
Look at the tight, completely isolated clusters for math_basic (magenta), code_simple (orange), and knowledge (green). The model isn’t just generating text; it is routing these queries to highly specialized, distinct regions of its “brain” (its latent space).
Interestingly, the abstract prompts (blue) and logic_chain prompts (red) are broken into multiple tiny sub-clusters scattered around the edges. This tells us that “abstract” isn’t a single behavior to the LLM; it triggers several different internal semantic pathways.
When a company (like DeepSeek) attempts to distill a frontier model (like OpenAI’s), they don’t just want random data. They need to systematically map and extract the entire semantic landscape. If an attacker only queried the green cluster (commonsense), their cloned student model would be completely incapable of writing code or doing math.
Infrastructure-level defense: timing-based anomaly detection
Infrastructure-level defense: timing-based anomaly detection
A latency vs tokens total chart with anomalies highlighted by Isolation Forest. Normally with prompt complexity getting higher, the latency gets higher, that is why we see the linear trend of the data. Having points outside the trend such as low token, high latency points in top left or high token, high latency in top right indicates unusual behaviour that worth checking. Attackers cannot easily fake the math of how GPUs generate tokens, making this a good defense tool against model extraction.
CITE THIS NOTEBOOK
CITE THIS NOTEBOOK
Analyzing LLM extraction (distillation) attacks: latent clustering & latency-based anomaly detection
by Ahmed Elbanna
Wolfram Community, STAFF PICKS, March 10, 2026
https://community.wolfram.com/groups/-/m/t/3656501
by Ahmed Elbanna
Wolfram Community, STAFF PICKS, March 10, 2026
https://community.wolfram.com/groups/-/m/t/3656501