For any two points on the Earth, the geodesic (as the crow flies) distance between them is usually different from the travel distance (along roads). For example, the fastest driving route from Boston to Dallas is about 1750 miles long, but the geodesic distance between Boston and Dallas (as the crow flies) is only about 1520 miles. Ignoring practicality, there could have been a perfectly straight road directly from Boston to Dallas, in which case the travel distance would equal the straight line or geodesic distance. In that sense, real-world road networks are not perfectly efficient because drivers have to take routes which are not perfectly straight lines from origin to destination.
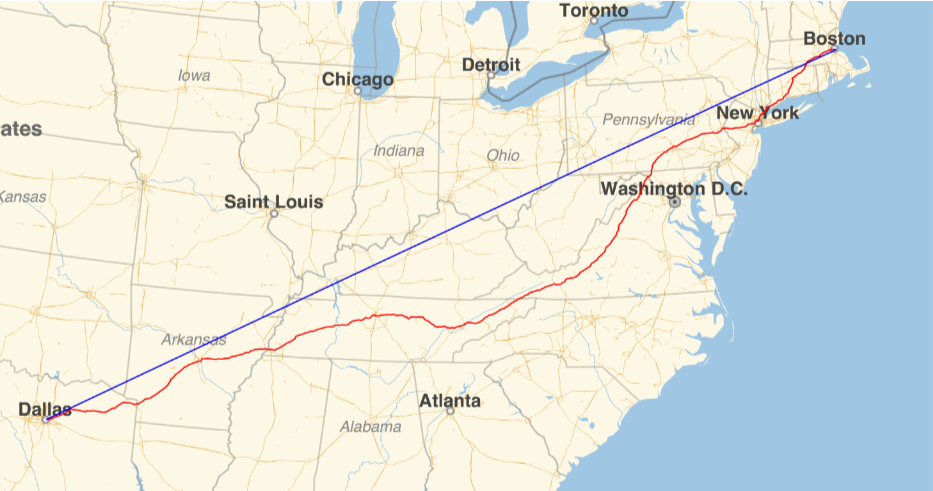
The efficiency of a route can be measured by computing the geodesic distance divided by the route length. In the case above, because the route from Boston to Dallas is about 1750 miles long and the geodesic between Boston and Dallas is about 1520 miles, the route efficiency is 1520/1750 = 0.869. If a route were perfectly direct, then its efficiency (by this measure) would be 1. If it were twice as long as a perfectly direct route, then its efficiency would be 0.5. In general, if a route is x times as long as the geodesic between its endpoints, then its efficiency is 1/x. There is an important distinction between the shortest route and the fastest route. For this project, I used the fastest route because that is what real drivers use. However, the same methods can be used for shortest routes.
Route efficiency is useful for a number of reasons. Here are a few examples:
◼
It is often simpler to compute the geodesic distance than it is to compute the travel distance, so the geodesic distance is often used as an approximation of the route distance. By looking at the distribution of route efficiencies for millions of routes, we can check whether the geodesic distance is a good approximation of the travel distance.
◼
Route length is closely related to fuel consumption, which is in turn related to cost, and so route efficiency is important for logistics.
◼
By looking at how route efficiency varies with geodesic distance, it is possible to study some of the scale-free properties of road networks.
In order to measure the efficiency of an entire road network, as opposed to the efficiency of a single route, I compute the route efficiencies for a large number of random routes within the area of interest. More specifically, I generate thousands to millions of pairs of population-weighted random points within the target area, compute the fastest routes between those pairs of points, compute the route efficiencies of those routes, and take the mean. It is important that the random points be generated proportional to population because otherwise some sparely populated territories (i.e. northern Canada or Siberia) have a disproportionate impact on the analysis. Conveniently, this measure can also be interpreted as the expected value of route efficiency between any two randomly chosen people within the area of interest.
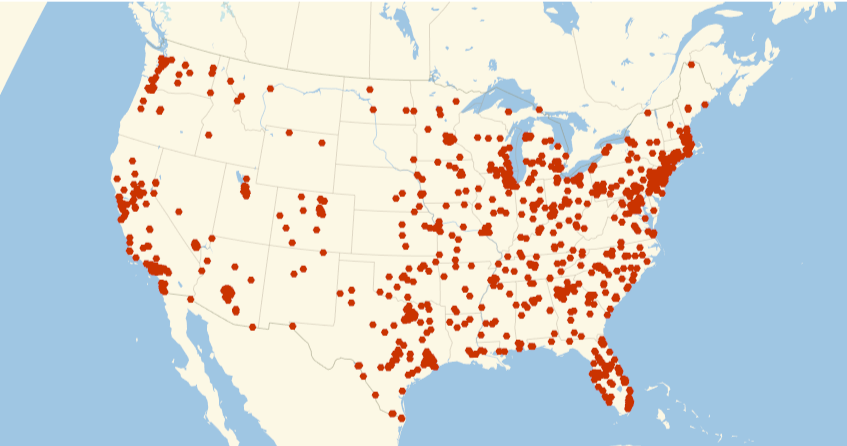
The first step in computing the route efficiency of a road network is to generate population-weighted pairs of points. By “population-weighted”, I mean that the probability of picking a point in some region is proportional to the population of that region, so that the distribution of points roughly matches the distribution of people (see the figure below for an example in the United States). I used the highest-resolution gridded population estimates from SEDAC, which aggregates data from censuses around the world. This would probably be unnecessary if the goal were only to look at travel efficiency within a single country, but having population data from a consistent source for the whole Earth is important for looking at route efficiency in places like Europe where the road network crosses national borders. The figure below shows 2000 population-weighted random points in the contiguous United States:
The next step in computing route efficiency of a road network is routing. For this, I used OSRM with data from OpenStreetMap (OSM). I decided to focus on North America and Europe because these are the places where OSM has the best coverage. That said, the OSM files for these regions are altogether about 35GB, and OSRM’s preprocessing phase requires a huge amount of RAM on these large files, so I had to do the preprocessing on EC2.
Before routing, each randomly selected point is snapped to the nearest point on the road network. If the nearest point on the road network is more than 5km away from the original point, then it is removed from the results.
Setting up OSRM
Setting up OSRM
Download relevant OSM data from https://download.geofabrik.de.
Preprocessing
Preprocessing
In[]:=
baseDirectory="~/Documents/osrm/";mxDirectory=FileNameJoin[{ParentDirectory[NotebookDirectory[]],"MX"}];
This example shows how to preprocessing (using CH):
osrm-extract north-america-latest.osm.pbf -p /usr/local/share/osrm/profiles/car.lua
osrm-contract north-america-latest.osrm
osrm-contract north-america-latest.osrm
To start the server, run:
osrm-routed north-america-latest.osrm --max-table-size=1000000000
Use the constantSpeed.lua profile for the extraction step to get constant speed variants.
Interface functions
Interface functions
The address of the routing server:
In[]:=
routingBase="http://0.0.0.0:5000/";
Formats coordinates appropriately for OSRM endpoints:
In[]:=
coordinateOsrmRequest[ps_]:=StringJoin@Flatten@Riffle[Riffle[Reverse@#,","]&/@Map[ToString,ps,{2}],";"]coordinateOsrmRequest[ps:{__GeoPosition}]:=coordinateOsrmRequest[ps[[All,1,;;2]]]coordinateOsrmRequest[gp_GeoPosition]:=coordinateOsrmRequest[Thread[gp]]
Computes distance matrices, returning both the distance matrix and time matrix (in units of meters and seconds)
In[]:=
osrmDistanceMatrices[ps_,d_:Quantity[Infinity,"Meters"]]:=Enclose@With[{r=Confirm[ImportString[ToString[Confirm@URLRead[URLBuild[{routingBase,"table","v1","driving",coordinateOsrmRequest[ps]},{"annotations""distance,duration","generate_hints"False}],"Body"],CharacterEncoding"UTF8"],"RawJSON"]]},With[{indices=Position[Quantity[#,"Meters"]&/@Confirm[r["sources"]][[All,"distance"]],_?(LessThan[d]),{1},HeadsFalse][[All,1]]},<|"TravelDistances"QuantityArray[Confirm[r["distances"]][[indices,indices]]/.NullMissing[],"Meters"],"TravelDurations"QuantityArray[Confirm[r["durations"]][[indices,indices]]/.NullMissing[],"Seconds"],"Locations"GeoPosition[Reverse/@Confirm[r["sources"]][[indices,"location"]]]|>]]
Gridded population estimates
Gridded population estimates
We use the 2020 version of “UN WPP-Adjusted Population Count, v4.11”, available at https://sedac.ciesin.columbia.edu/data/set/gpw-v4-population-count-adjusted-to-2015-unwpp-country-totals-rev11/data-download.
Import the maximum resolution map:
In[]:=
populationMap=Ramp@Import[FileNameJoin[{baseDirectory,"gpw-v4-population-count-adjusted-to-2015-unwpp-country-totals-rev11_2020_30_sec_tif","gpw_v4_population_count_adjusted_to_2015_unwpp_country_totals_rev11_2020_30_sec.tif"}]];
Define a function for converting between grid coordinates and lat/long:
In[]:=
coordPixel[{lat_,long_}]:={Rescale[long,{-180,180},{0,ImageDimensions[populationMap][[1]]}],Rescale[lat,{-90,90},{0,ImageDimensions[populationMap][[2]]}]}coordPixel[GeoPosition[{lat_,long_}]]:=coordPixel[{lat,long}]
In[]:=
pixelCoord[{x_,y_}]:=GeoPosition[{Rescale[y,{0,ImageDimensions[populationMap][[2]]},{-90,90}],Rescale[x,{0,ImageDimensions[populationMap][[1]]},{-180,180}]}]
Define a function for randomly sampling population weighted points:
In[]:=
populationWeightedSample[p_,n_]:=Module[{pixelBounds,coordBounds,dims,mask,localPopMap,borderFuzz,targetPixels,probs,pixels},pixelBounds={Floor[#1],Ceiling[#2]}&@@coordPixel/@GeoBoundingBox[p];coordBounds={pixelCoord[pixelBounds[[1]]][[1]],pixelCoord[pixelBounds[[2]]][[1]]};dims=-Subtract@@pixelBounds;mask=ImageReflect[ColorNegate[Binarize[Rasterize[Graphics[Style[p/.GeoPositionIdentity,AntialiasingFalse],PlotRangeTranspose[coordBounds]](*,ImageSizeReverse[dims]*),RasterSizeReverse[dims]]]],TopRight];(*AlternateversionusingGeoGraphics.Morerobustbutslower.*)(*mask=ColorNegate@Binarize[Rasterize[GeoGraphics[{GeoStyling[Opacity[1]],Style[p,AntialiasingFalse]},GeoRangeTranspose[coordBounds],GeoProjection"Equirectangular",GeoBackgroundWhite],ImageSize-Subtract@@pixelBounds,RasterSize-Subtract@@pixelBounds]];*)localPopMap=ImageTrim[populationMap,pixelBounds+{1,-1}];(*Borderfuzzmakessurethatcoastalcitiesgetcountedbyaddingfuzzaroundoceans*)borderFuzz=With[{i=Binarize[localPopMap,{0,0}]},i-Erosion[i,1]];targetPixels=PixelValuePositions[Binarize[mask+Dilation[mask,1]*borderFuzz,0.5],1];probs=PixelValue[localPopMap,targetPixels];If[Max[probs]>0,pixels=RandomChoice[probstargetPixels,n];(*Thisaddsnoisesothatpointsbetweenpixelscanbechosen*)pixels+=RandomReal[{0,1},If[ListQ[n],Append[n,2],{n,2}]];GeoPosition@Map[Reverse[MapThread[Rescale,{#,Thread[{1,dims}],Reverse[Transpose[coordBounds]]}]]&,pixels,{If[ListQ[n],Length[n],1]}],GeoPosition[{}]]]populationWeightedSample[GeoDisk[c_,r_],n_]:=populationWeightedSample[Polygon[GeoDestination[c,{r,Range[0,360,1]}]],n]
Randomly pick points in the United States (only plotting the contiguous United States):
In[]:=
GeoListPlotpopulationWeightedSample["Polygon"],1000,

Out[]=
Route Efficiency
Route Efficiency
I started by computing the route efficiency between 4 million population-weighted pairs of points in the contiguous United States.
General
General
Define a function for generating population-weighted random points and calculate the associated distance/time matrices:
In[]:=
generateRandomTables[poly_,n_,d_:Quantity[5,"Kilometers"]]:=With[{r=osrmDistanceMatrices[populationWeightedSample[poly,n],d]},If[FailureQ[r],<|"Locations"0,"GeoDistances"{},"TravelDistances"{},"TravelDurations"{}|>,<|"Locations"r["Locations"],"GeoDistances"DistanceMatrix[r["Locations"]],"TravelDistances"r["TravelDistances"],"TravelDurations"r["TravelDurations"]|>]]
Define functions for computing the distance and travel efficiency:
Gather basic statistics given distance matrices:
Local sampling
Local sampling
Define a function for sampling points on a triangular lattice:
The latter definition will generate approximately count points on a triangular lattice within the region r.
For each of n sample points on a triangular lattice in region, compute the distance and travel efficiency of a disk with radius 50 miles:
Analysis
Analysis
Generating data
Generating data
United States:
Europe:
Constant rate
Constant rate
Basic analysis
Basic analysis
Time efficiency
Time efficiency
Next, I looked at a variant of route efficiency which is based on travel time instead of distance. Instead of computing the geodesic length divided by the route length, I computed the geodesic length divided by the route duration. This measure of time efficiency is just the distance traveled divided by the time, so it can also be interpreted as the magnitude of the mean velocity in the direction of the destination. For example, Boston and Chicago are about 856 miles apart, and the fastest route from Boston to Chicago takes about 16.5 hours, so the time efficiency is 856/16.5 mph = 51.9 mph, which is the magnitude of the mean velocity on that fastest route.
Time efficiency and route efficiency each have their own uses. Route efficiency measures the directness of a route, and it approximates the excess resources (like fuel) needed to move on the travel network compared with geodesics. Time efficiency, on the other hand, measures how fast a driver can move on the road network. For some uses, travel distance is more important (like a logistics company trying to minimize fuel consumption), and for others travel time is more important (like a commuter trying to minimize their time on the road). Much of the analysis for route efficiency can also be done with time efficiency, so here I reproduce some of the most important route efficiency results with time efficiency.
Below are histograms showing the distributions of time efficiency for the United States and Europe. The results are similar to route efficiency, except Europe’s mean is slightly closer to the US’s:
As with route efficiency, these distributions are relatively tight, with almost all routes in the US having a time efficiency between 40 and 50 mph.
Route efficiency vs distance
Route efficiency vs distance
Look at route efficiency as a function of geodesic distance:
Very short routes:
The results are mostly flat, especially in the US, meaning short routes are about as efficient as long ones, which aligns with some theories about the scale-free properties of road networks. There is a noticeable dip in efficiency for the longest routes, but this is probably an artifact of the small number of routes which are so long, together with the fact that the extreme longest routes generally have endpoints on peninsulas or in other unusual geographic situations. There is also a dip for the shortest routes, which can be seen better with this zoomed-in version of the above plot:
Here we can see that there is another regime governing routes within 5 miles or so, where short routes are less efficient than longer ones. Zooming-in further, we see that there is yet another regime governing even shorter routes within a radius of 0.2 miles or so:
So to summarize, there seem to be three regimes of route efficiencies. For routes longer than about 5 miles, route efficiency is largely independent of route length. For routes between 0.2 and 5 miles, longer routes are more efficient, but with diminishing returns. For routes shorter than 0.2 miles, shorter routes are more efficient.
In order to understand how these regimes come about, I generated visualizations of some example routes at these different scales:
With these maps, it was possible to come up with some hypotheses about the different regimes. The short-scale routes are small enough to consist of a single road segment with few turns, in which case it is unsurprising that the resulting routes are straight. These routes are smaller than the feature size of the road network, and so they are trivially efficient.
Mid-scale routes involve intracity travel. They are long enough that there is no single road from origin to destination, but short enough that there are only a handful of route choices. For these, it is worth it to take large roads, but there may only be a single viable choice, leading to inefficient routes. Otherwise, they are left navigating smaller roads which are often laid out in patterns (e.g. grids) that also lead to inefficient routes.
Long-scale routes involve intercity travel, and are long enough to have a selection of large roads to follow, allowing for more direct routes.
State-by-state
State-by-state
For each country in Europe (excluding Russia), compute the travel efficiency:
Country-by-country in Europe
Country-by-country in Europe
For each country in Europe (excluding Russia), compute the travel efficiency:
Local sampling
Local sampling
Get the region for the contiguous United States with an orthographic projection:
For each of 10000 sample points on a triangular lattice in the United States, compute the distance and travel efficiency of a disk with radius 50 miles:
Please find the input data “usLocalResults” in the attached notebook at the end of the post.
Smaller radius:
Please find the input data “usLocalResults2” in the attached notebook at the end of the post.
Local route efficiency
Local route efficiency
Finally, I looked at how route efficiency varies with geography. Up to this point, I had only looked at the mean route efficiency on the scale of countries or states, but I wanted to see how route efficiency varies on smaller scales, and how it interacts with geographic phenomena like mountains, cities, or country borders.
In order to compute the local route efficiency at a point p, I generated a disk centered on p with radius 50 miles, computed 10000 routes between population-weighted points in that disk, and took the mean. I did this for 10000 uniformly placed points in the contiguous United States, and plotted the results:
There is a lot to talk about in this map. Route efficiency is significantly lower in mountainous areas like Appalachia, northern Arkansas, and many areas in the West. It is hard to tell whether all of the route inefficiency in the West is attributable to mountains or whether low population density plays a role as well. The Central Valley of California is also particularly visible.
For Europe:
Download the range of the OSM data:
Compute the region covered by the OSM data:
For each of 10000 sample points on a triangular lattice over Europe, compute the distance and travel efficiency of a disk with radius 50 miles:
Again, mountains explain much of the variance in route efficiency. The Alps, Carpathian Mountains (between Romania and Ukraine), and Caucasus Mountains (around Georgia) are all clearly visible, as well as mountains in Norway, the Balkans and Turkey. The inefficient routes in western Russia (just east of Finland) seem to be the result of a few large lakes.
Conclusion
Conclusion
To sum up, here are some of the results from this project:
◼
For routes longer than about 50 miles, route efficiency is approximately uniform, and so geodesic distance is a good approximation for travel distance when dealing with long routes in a country like the US.
◼
Route efficiency is determined by different factors at different scales. In the short-range regime (<0.2 miles) routes are essentially straight lines and are generally efficient. In the mid-range regime (>0.2 miles but <5 miles) routes rely on a small number of large roads and are generally inefficient. In the long-range regime (>5 miles), routes have a wide variety of major roads to chose from, and are generally efficient.
◼
Overall route efficiency is lower in Europe compared with the US.
◼
Route efficiency is negatively affected by mountains.
◼
Time efficiency can differ significantly from route efficiency.
Bibliography
Bibliography
Gridded population methods:
https://sedac.ciesin.columbia.edu/data/collection/gpw-v4/methods/method1
https://sedac.ciesin.columbia.edu/data/collection/gpw-v4/methods/method1
“Connected Spatial Networks over Random Points and a Route-Length Statistic”
https://arxiv.org/pdf/1003.3700.pdf
https://arxiv.org/pdf/1003.3700.pdf
“A Route-Length Efficiency Statistic for Road Networks” [DRAFT]
https://www.stat.berkeley.edu/~aldous/Spatial/paper.pdf
https://www.stat.berkeley.edu/~aldous/Spatial/paper.pdf
CITE THIS NOTEBOOK
CITE THIS NOTEBOOK
Efficiency of road networks
by Christopher Wolfram
Wolfram Community, STAFF PICKS, March 28, 2024
https://community.wolfram.com/groups/-/m/t/3149145
by Christopher Wolfram
Wolfram Community, STAFF PICKS, March 28, 2024
https://community.wolfram.com/groups/-/m/t/3149145