YouTube video: https://youtu.be/4K3uK-b6nm0
Twitter post: https://twitter.com/bencbartlett/status/1326272375332114433
Math animations collection: https://muon.people.stanford.edu/math-animations
Twitter post: https://twitter.com/bencbartlett/status/1326272375332114433
Math animations collection: https://muon.people.stanford.edu/math-animations
As stars burn hotter and hotter, they go from looking red to orange to yellow to white to blue... But why are there no green stars?
Starlight looks basically like an ideal blackbody spectrum: a broad curve with the peak wavelength depending on the temperature. However, our eyes see in a 3-dimensional color space by sampling the intensities of red, green, and blue light. Cool stars emit mostly in infrared, which we can’t see, but within the visible spectrum, they emit much more red light than blue/green. Hot stars shine mostly in UV, but emit more blue than red/green. But if the peak emission wavelength is green, then the broad blackbody curve is centered in the visible spectrum. So star emits roughly the same amount of red, green, and blue light, appearing white!
Starlight looks basically like an ideal blackbody spectrum: a broad curve with the peak wavelength depending on the temperature. However, our eyes see in a 3-dimensional color space by sampling the intensities of red, green, and blue light. Cool stars emit mostly in infrared, which we can’t see, but within the visible spectrum, they emit much more red light than blue/green. Hot stars shine mostly in UV, but emit more blue than red/green. But if the peak emission wavelength is green, then the broad blackbody curve is centered in the visible spectrum. So star emits roughly the same amount of red, green, and blue light, appearing white!
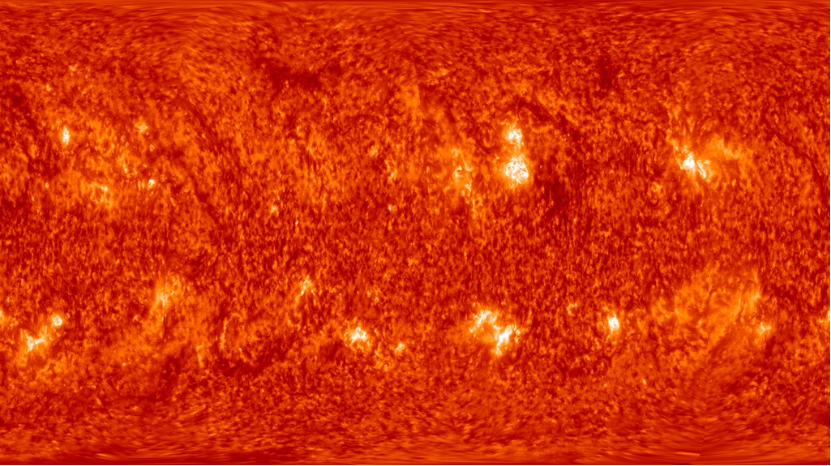
Sun color replace
Sun color replace
In[]:=
SetDirectory[NotebookDirectory[]];
sunIm=
;
In[]:=
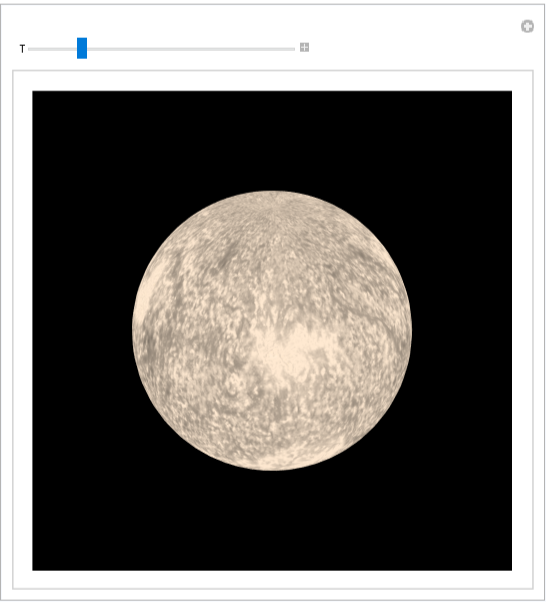
sunImRecolor=ImageRecolor[sunIm,ColorsNear[Red,0.3]ColorData["BlackBodySpectrum"][7000]];sun=SphericalPlot3D[1.5,{u,0,Pi},{v,0,2Pi},PlotPoints50,MeshNone,BoxedFalse,AxesNone,TextureCoordinateFunction({#5,1-#4}&),PlotStyleDirective[Texture[sunImRecolor]],Lighting"Neutral"];
In[]:=
StarTemp[T_]:=Module[{texture},texture=ImageRecolor[sunIm,ColorsNear[Red,0.4]ColorData["BlackBodySpectrum"][T]];Show[SphericalPlot3D[1,{u,0,Pi},{v,0,2Pi},PlotRange{{-1,1},{-1,1},{-1,1}},PlotPoints50,MeshNone,BoxedFalse,AxesNone,TextureCoordinateFunction({#5,1-#4}&),PlotStyleDirective[Texture[texture]],Lighting{"Ambient",ColorData["BlackBodySpectrum"][T]}],BackgroundBlack]]Manipulate[StarTemp[T],{{T,5500},2000,20000},SaveDefinitionsTrue]
In[]:=
Overlapping RGB
Overlapping RGB
Code from this part was modified from https://demonstrations.wolfram.com/OverlappingLightColors/
In[]:=
intensity[T_,λ_]:=With[{h=6.626210^-34,c=2.9979245810^8,k=1.380710^-23},2hc^2/λ^51/(Exp[hc/(λkT)]-1)];
In[]:=
RGBPlot[T_,imsize_:500]:=Moduleplane=ParametricPlot3D[{u,v,-2},{u,-7,7},{v,-7,7},PlotPoints200,MaxRecursion2,MeshNone,AxesFalse,BoxedFalse,PlotStyleBlack],R0=intensity[T,700*],G0=intensity[T,530*],B0=intensity[T,460*],R,G,B,r=1,θ=2π3,ϕ=2π3,R=R0Max[R0,G0,B0];G=G0Max[R0,G0,B0];B=B0Max[R0,G0,B0];Rasterize[ParametricPlot3D[{u,v,-2},{u,-5,5},{v,-5,5},PlotRange{{-5,5},{-5,5},{-3,0}},PlotPoints400,MaxRecursion1,MeshNone,AxesFalse,BoxedFalse,PlotStyle{Black,Specularity[10]},Lighting{{"Spot",RGBColor[0,G,0],{{0,-r,5},{0,-r,0}},Pi/8},{"Spot",RGBColor[R,0,0],{{-rSin[θ+π],rCos[θ+π],5},{-rSin[θ+π],rCos[θ+π],0}},Pi/8},{"Spot",RGBColor[0,0,B],{{rSin[ϕ+π],rCos[ϕ+π],5},{rSin[ϕ+π],rCos[ϕ+π],0}},Pi/8}},ViewPointAbove,ImagePaddingNone,ImageSizeimsize],Background->None,RasterSizeimsize,ImageSizeimsize];
-9
10
-9
10
-9
10
Thermometer
Thermometer
In[]:=
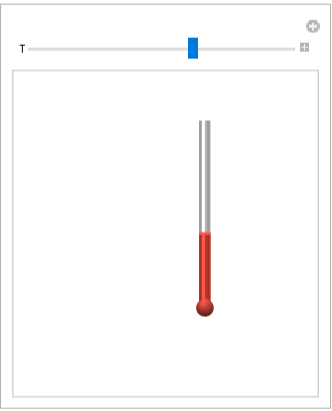
thermometer[T_]:=ThermometerGauge[Quantity[T,"Kelvins"],Quantity[{0,15000},"Kelvins"],GaugeLabels"Unit",TicksStyleWhite(*,Ticks{{0,"0K"},{5000,"5000K"},{10000,"10000K"},{15000,"15000K"}}*),LabelStyleDirective[White,40],BackgroundTransparent];Manipulate[thermometer[T],{{T,5500},3000,7000},SaveDefinitionsTrue]
Out[]=
Blackbody spectrum
Blackbody spectrum
In[]:=
Blackbody[T_,imsize_:500]:=With[{h=6.626210^-34,c=2.9979245810^8,k=1.380710^-23,fs=45},Show[Plot[2hc^2/λ^51/(Exp[hc/(λkT)]-1),{λ,0,100010^-9},PlotRange{All,Automatic},MaxRecursion1,Frame{True,True,False,False},FrameLabel{Style["wavelength (nm)",fs,White],Style["normalized intensity",fs,White]},FrameTicks{{{110^-7,"100"},{210^-7,"200"},{310^-7,"300"},{410^-7,"400"},{510^-7,"500"},{610^-7,"600"},{710^-7,"700"},{810^-7,"800"},{910^-7,"900"},{1010^-7,"1000"}},None},FrameTicksStyleDirective[White,.7*fs],ColorFunction(ColorData["VisibleSpectrum","ColorFunction"][#*10^9]&),ColorFunctionScalingFalse,FillingAxis,FillingStyleAutomatic,PlotStyle{White,Thick},Epilog{LightGray,Line[{{40010^-9,0},{40010^-9,510^18}}],Line[{{70010^-9,0},{70010^-9,510^18}}],Text[Style["UV","Label",fs,White],ImageScaled[{.35,.24}]],Text[Style["visible","Label",fs,Black],ImageScaled[{.575,.24}]],Text[Style["IR","Label",fs,White],ImageScaled[{.78,.24}]]}],Plot[2hc^2/λ^51/(Exp[hc/(λkT)]-1),{λ,0,100010^-9},PlotRange{All,Automatic},MaxRecursion2,PlotStyle{LightGray,Thickness[.005]}],BackgroundTransparent,ImageSize{imsize,.8*imsize},ImagePaddingAll]](*Quiet@Blackbody[15000,1000]*)
Putting it all together
Putting it all together
CITE THIS NOTEBOOK
CITE THIS NOTEBOOK
Why is there no green starlight?
by Ben Bartlett
Wolfram Community, STAFF PICKS, February 15, 2022
https://community.wolfram.com/groups/-/m/t/2472460
by Ben Bartlett
Wolfram Community, STAFF PICKS, February 15, 2022
https://community.wolfram.com/groups/-/m/t/2472460