ABSTRACT (original article): This study proposes an advanced algorithm for predicting the optimal orientation in human manikin 3D printing. We can print the manikin mesh data on any scale depending on the user’s needs. Once the 3D printing scale was determined, the manikin data were dissected based on the 3D printer’s maximal printing volume using our previous work. Then, we applied the newly proposed algorithm, designated as “per-pixel signed-shadow casting,” to each dissected manikin part to calculate the volumes of the object and the support structure. Our method classified the original mesh triangles into three groups—alpha, beta, and top-covering—to eliminate the need for special hardware such as graphic cards. The result is shown as a two-dimensional bitmap file, designated as “tomograph”. This tomograph represents the local support structure distribution information on a visual and quantitative basis. Repeating this tomography method for the three rotational axes resulted in a four-dimensional (4D) box-shaped graph. The optimal orientation of any arbitrary object is easily determined from the lowest-valued pixel in the 4D box graph. We applied this proposed method to several basic primitive shapes with different degrees of symmetry and complex shapes, such as the famous “Stanford Bunny”. Finally, the algorithm was applied to human manikins using several printing scales. The theoretical values were compared with those obtained from analytical or g-code-based experimental volumes. CITATION (original article): Jung, J.Y., Chee, S. & Sul, I.H. Support structure tomography using per-pixel signed shadow casting in human manikin 3D printing. Fash Text 9, 21 (2022). https://doi.org/10.1186/s40691-022-00290-z
Introduction
Introduction
Most 3D printers, except for the relatively expensive SLS type, need a support structure (SS) when the object’s inclination is more than a certain threshold angle (a.k.a. filment critical angle, ). The more SS means the more printing time and filament usage. Fortunately, the volume of SS () can be minimized by choosing a proper printing direction (object’s 3D orientation, designated as (yaw, pitch, roll) in this work). This work voxelized the input mesh to find the amount of SS of a given orientation. Repeating the following procedure, varying the orientation, can give the optimal orientation information.
θ
c
V
ss
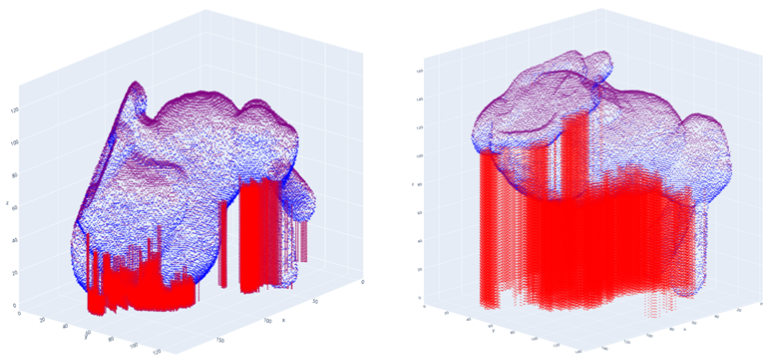
Figure 1. support structure examples in the optimal (left) and worst (right) orientation of Stanford Bunny (image captured with Python 3)
If is zero, can be simply thought of as a shadow volume created by a virtual sunlight and the target object (Figure 2d). Zero means that every inclination of the object needs SS. In this case, can be simply calculated by,
θ
c
V
ss
θ
c
V
ss
V
ss
V
tc
V
o
(
1
)V
o
V
tc
V
tc
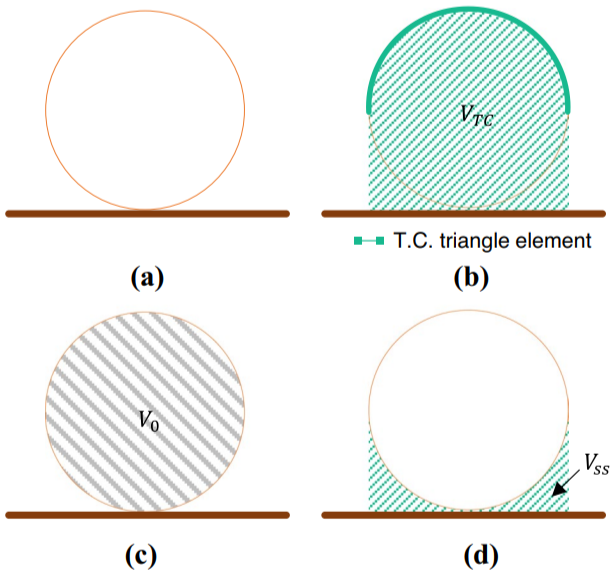
Figure 2. Ezair et al.’s shadow-casting based support structure calculation scheme (a) Target object, (b) Calculating top-cover volume () using GPU, (c) calculating object volume (), (d) final support structure volume
V
tc
V
o
Our modified idea : per - pixel signed shadow casting
Our modified idea : per - pixel signed shadow casting
Unfortunately, the 3D printing filaments have non-zero (generally 45~60 degrees) values. It means that some parts of overhangs do not need a support structure. We designated them as Non-oVerhang (NV) pixels. Then Eq. (1) should be modified to a more general form, Eq. (2).
θ
c
V
ss
V
tc
V
o
V
nv
V
tc
V
α
V
β
V
nv
(
2
)In this case, the exact amount of Vss can be only known by pixel-wise ray-casting-like computation. We voxelized the object's mesh surface and stored their information as (X,Y,Z, ), where the first three correspond to coordinates of voxel’s center of mass and the last one to normal vector z-component of the mother triangular element. We called this data structure a "pixel" in this work. Each pixel was classified into several different groups; α pixel if the normal vector faces upwards (i.e. > 0), β if downwards ( < 0), NV pixel if β pixel do not satisfy threshold condition (-sin < < 0). And top-most pixels among the same (X,Y) position were classified as the Top-Covering (TC) pixel. Now integrating each pixel group's Z-coordinates can lead to the corresponding volume. The whole procedure is like Figure 3.
n
z
n
z
n
z
θ
c
n
z
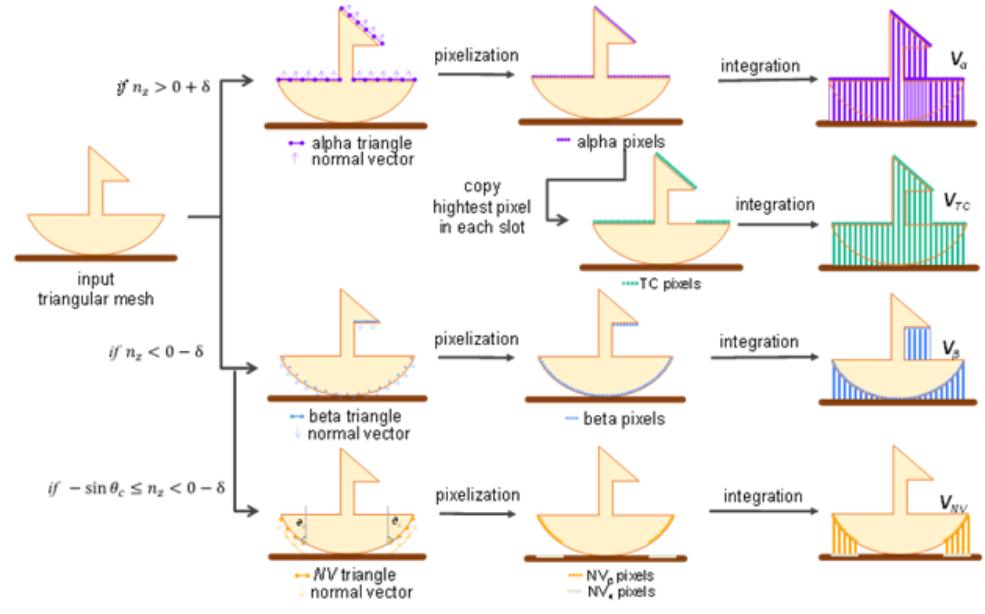
Figure 3. Implicit calculation of support structure volume (Vss)
Mathematica code example
Mathematica code example
(0) Internal Functions
(0) Internal Functions
(1) File loading and voxelization
(1) File loading and voxelization
Enter filename and orientation angle here
In[]:=
FileName="Bunny_1k.obj";{Yaw,Pitch,Roll}={0.Degree,0.Degree,0.Degree};
g - code options from slicing software (Default values were borrowed from those of Sindoh DP - 101 FDM - type printer)
In[]:=
T
clad
ρ
PLA
F
clad
F
core
F
ss
θ
c
Target mesh loading
In[]:=
ℳ=Import[FileNameJoin[{NotebookDirectory[],FileName}],"MeshRegion"];(*initialmesh,beforerotation*)
(2) Rotation, pixel group classification, and volume/mass calculation
(2) Rotation, pixel group classification, and volume/mass calculation
Mesh rotation
In[]:=
ℛ=TransformedRegion[ℳ,Get4DMatrix[ℳ,Yaw,Pitch,Roll]];(*meshafterrotation.*)maxℛℬ=RegionBounds[ℛ];(*boundingboxofℛ.Shouldbesmallerthanthe3Dprinter'svolume*)
Voxelization step (time - consuming)
In[]:=
{,,,,normalVectors}=GetPxlGroups[ℛ,];(*pixelgroupsaftervoxelization*)=GetVoPxls[,];(*eq.(1);=-Vβ*)=GetVssPxls[,,,];(*eq.(2);=-Vα+-*)
plist
α
plist
β
plist
tc
plist
nv
θ
c
plist
vo
plist
α
plist
β
V
o
V
α
plist
ss
plist
β
plist
α
plist
tc
plist
nv
V
ss
V
β
V
tc
V
nv
Calculate volumes
In[]:=
{,,,,}=Map[GetPxlVol,{,,,,}];(*objectvolume*)=-;
V
α
V
tc
V
β
V
nv
V
ss
plist
α
plist
tc
plist
β
plist
nv
plist
ss
V
o
V
α
V
β
Split the object volume into core (inner volume) and clad (surface) to consider fill factor
In[]:=
A
clad
V
clad
A
clad
T
clad
V
core
V
o
V
clad
Calculate masses from the volume values
In[]:=
M
clad
V
clad
F
clad
ρ
PLA
M
core
V
core
F
core
ρ
PLA
M
ss
V
ss
F
ss
ρ
PLA
M
total
M
core
M
clad
M
ss
Out[]=
31.4153
(4) 3D Rendering (Optional)
(4) 3D Rendering (Optional)
Prepare graphs for each pixel list
{,,,}=Map[PlotPxls,{{,},{,},{,},{,}}];{,}=Map[PlotPxlsWithAxes,{{,},{,}}];=Show[Graphics3D[{EdgeForm[{White}],Opacity[0.3,White],ℛ}],AxesFalse,BoxedFalse,PlotRange->maxℛℬ];(*showtherotatedmesh*)
g
α
g
β
g
tc
g
nv
plist
α
color
α
plist
β
color
β
plist
tc
color
tc
plist
nv
color
nv
g
vo
g
ss
plist
vo
color
vo
plist
ss
color
ss
g
ℛ
Show the graphs at a time
In[]:=
ManipulateShow[{f[[choice]]},BoxRatiosAutomatic],RowCheckboxBarDynamic[choice],1Style["α pixels",FontColor],2Style["TC pixels",FontColor],3Style"β pixels",FontColor,4Style["NV pixels",FontColor],5Style["Vo",FontColor],6Style["Vss",FontColor],7Style["target mesh",FontColorGray],Appearance"Horizontal",{{choice,{6,7}},None},ControlPlacementBottom,Initializationf={,,,,,,};,SaveDefinitions->True
color
α
color
tc
color
β
color
nv
color
vo
color
ss
g
α
g
tc
g
β
g
nv
g
vo
g
ss
g
ℛ
Finding optimal orientation
Finding optimal orientation
Figure 4. optimal orientation search result for Standford Bunny (X,Y, and Z axes mean yaw, pitch, and roll values)
Bottom structure
Bottom structure
The amount of bottom structure, such as skirt, brim, and raft, was omitted in this version for the simplicity’s sake. Please refer to our recent python version (https://github.com/cfms-lab/tomo_TSE2023).
Acknowledgement
Acknowledgement
This notebook was written with Mathematica 13.0.1. version. This work was supported by the National Research Foundation of Korea (NRF) grant funded by the Korea government (MSIT) (No. 2019R1F1A1040883, No.2022R1A2C1010072).
CITE THIS NOTEBOOK
CITE THIS NOTEBOOK
Support structure tomography using per-pixel signed shadow casting in human manikin 3D printing
by Jin Young Jung, Seonkoo Chee & In Hwan Sul
Wolfram Community, STAFF PICKS, May 21, 2024
https://community.wolfram.com/groups/-/m/t/3180028
by Jin Young Jung, Seonkoo Chee & In Hwan Sul
Wolfram Community, STAFF PICKS, May 21, 2024
https://community.wolfram.com/groups/-/m/t/3180028