In[]:=
SetDirectory[NotebookDirectory[]];
In[]:=
Needs["AnimationTools`"]
In[]:=
σ=10;ρ=28;β=8/3;Tmax=200;trange=30;
In[]:=
eqn={x'[t]σ(-x[t]+y[t]),y'[t]ρ*x[t]-y[t]-x[t]*z[t],z'[t]x[t]*y[t]-β*z[t]};IC={x[0]0,y[0]2,z[0]20};
Version 1: From an external perspective
Version 1: From an external perspective
In[]:=
soln=Quiet@NDSolve[SetPrecision[Join[eqn,IC],Infinity],{x[t],y[t],z[t]},{t,0,Tmax},PrecisionGoal8];points=Table[Evaluate[{x[t],y[t],z[t]}/.soln],{t,0,Tmax,.01}];(*Manipulate[t0=Max[0,0+tt];t1=Min[Tmax,trange+tt];Show[ParametricPlot3D[Evaluate[{x[t],y[t],z[t]}/.soln],{t,t0,t1},AxesFalse,BackgroundBlack,AxesLabel{"x","y","z"},BoxedFalse,ImageSizeLarge,PlotPoints200,MaxRecursion6,PlotRangeCoordinateBounds[points],ColorFunctionFunction[{x,y,z,t},Directive[ColorData["SolarColors"][(*.05+.85**)],]],ColorFunctionScalingFalse],Graphics3D[{PointSize.015,White,Glow[White],Point[{x[t],y[t],z[t]}/.soln/.ttrange+tt]}]],{tt,-(trange-0.001),100}]*)
4
((t-tt)/trange)
1
Opacity[(t-tt)/trange]
In[]:=
drawplot[tt_,imagesize_:1000]:=Module[{t0,t1},t0=Max[0,0+tt];t1=Min[Tmax,trange+tt];Show[ParametricPlot3D[Evaluate[{x[t],y[t],z[t]}/.soln],{t,t0,t1},AxesFalse,BoxedFalse,ImageSizeimagesize,PlotPoints200,MaxRecursion6,PlotRangeCoordinateBounds[points],BackgroundBlack,ColorFunctionFunction[{x,y,z,t},Directive[ColorData["SolarColors"][(*.05+.85**)],]],ColorFunctionScalingFalse],Graphics3D[{PointSize.012,White,Glow[White],Point[{x[t],y[t],z[t]}/.soln/.ttrange+tt]}]]]
4
((t-tt)/trange)
1
Opacity[(t-tt)/trange]
In[]:=
renderframe[tt_,imagesize_:2000]:=Module[{},img=Rasterize[drawplot[tt,imagesize]];cv=Table[ImageMultiply[ImageConvolve[img,GaussianMatrix[{r,r/3}]],r/15],{r,{5,15,30,80}*imagesize/1000}];outimg=ImageTake[ImageAdd[img,ImageAdd[cv]],{.15*imagesize,.9*imagesize}]]
In[]:=
renderframe[54.15,3000]
Out[]=
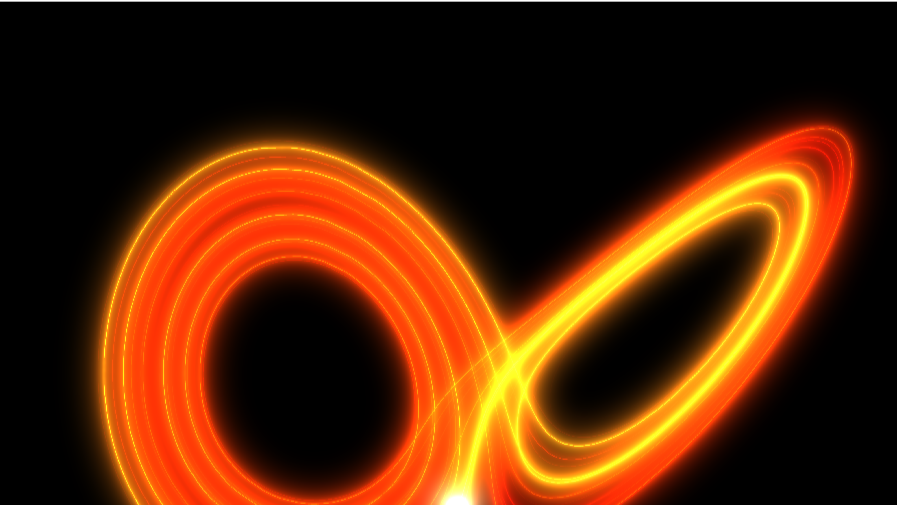
In[]:=
saveframe[tt_]:=Module[{frame,title},frame=renderframe[tt];title=IntegerString[Floor[(tt+trange)*1000],10,8]<>".png";Export["frames/"<>title,frame];];
In[]:=
(*Monitor[Do[saveframe[tt],{tt,-trange+0.0001,50,0.02}],ProgressIndicator[tt,{-trange,50}]]*)
Version 2: Following the viewpoint of the particle
Version 2: Following the viewpoint of the particle
In[]:=
trange=50;Tmax=300;soln=Quiet@First@NDSolve[SetPrecision[Join[eqn,IC],Infinity],{x[t],y[t],z[t]},{t,0,Tmax},PrecisionGoal8];points=Table[Evaluate[{x[t],y[t],z[t]}/.soln],{t,0,Tmax,.01}];
In[]:=
Clear[r,normVec,tanVec]
In[]:=
r[ttt_]:={x[t],y[t],z[t]}/.soln/.tttt;tanVec[ttt_]:=D[{x[t],y[t],z[t]}/.soln,t]/.tttt;ntanVec[ttt_]:=tanVec[ttt]/Norm[tanVec[ttt]];normVec[ttt_]:=D[{x[t],y[t],z[t]}/.soln,{t,2}]/.tttt;
In[]:=
center={0,0,20};
In[]:=
normToCenter[ttt_]:=center-r[ttt]/Norm[center-r[ttt]];crossToCenter[ttt_]:=Cross[ntanVec[ttt],normToCenter[ttt]];crossCurve[ttt_]:=Normalize[Cross[tanVec[ttt],normVec[ttt]]];
In[]:=
tlag=0.001;
In[]:=
Manipulate[t0=Max[0,0+tt];t1=Min[Tmax,trange+tt];tc=t1;Show[ParametricPlot3D[Evaluate[{x[t],y[t],z[t]}/.soln],{t,t0,t1},AxesFalse,BackgroundBlack,(*AxesLabel{"x","y","z"},*)BoxedFalse,ImageSizeLarge,PlotPoints500,MaxRecursion5,PlotRangeCoordinateBounds[points],ColorFunctionFunction[{x,y,z,t},Directive[ColorData["SolarColors"][(*.05+.85**)],]],ColorFunctionScalingFalse,ViewVertical-crossCurve[tc],ViewVector{r[tc-0.05]-.85*crossCurve[tc]+.0*normToCenter[tc],r[tc]+2*ntanVec[tc]},ViewRangeAll,ViewAngle100°],Graphics3D[{PointSize.015,White,Glow[White],Point[{x[t],y[t],z[t]}/.soln/.ttrange+tt](*,Arrowheads[0.01],Arrow[{r[t],r[t]+ntanVec[t]}/.soln/.ttrange+tt]*)}]],{tt,71,80}]
4
((t-tt)/trange)
1
Opacity[(t-tt)/trange]