The coffee roasting curve is a fundamental component in the coffee production process. The detailed analysis of this curve provides valuable information about the quality and roasting profile of the resulting coffee. However, this analysis can be complex and require a deep understanding of the data collected during roasting, leading to a prolonged duration for the analysis of multiple curves.
The combination of Wolfram Language and GPT models offers a powerful tool for analyzing the coffee roasting curve. By utilizing these technologies, roasters can gain a deeper understanding of the roasting processes in less time, identify improvement opportunities, and make informed decisions to produce a well-developed roasting profile, resulting in high-quality coffee with exceptional flavor.
What is a coffee roasting curve?
What is a coffee roasting curve?
Out[]=
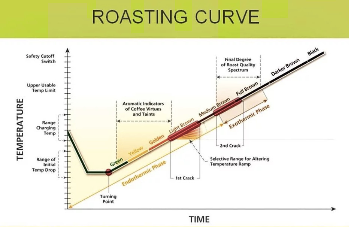
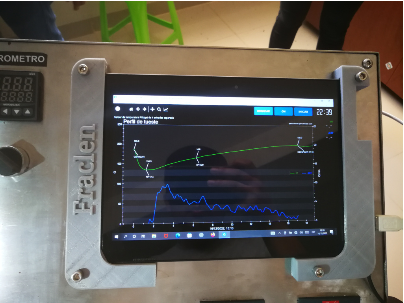
When carrying out the coffee roasting process in coffee roasting machines, the coffee roasting curve is used, which is a graph that shows how the temperature of the coffee beans changes over time. It allows us to see the time on the x-axis and the temperature on the y-axis.
The coffee roasting curve consists of different stages that reflect the physical and chemical changes that occur in the coffee beans during roasting. These stages can be identified and analyzed through the shape and characteristics of the curve:
The coffee roasting curve consists of different stages that reflect the physical and chemical changes that occur in the coffee beans during roasting. These stages can be identified and analyzed through the shape and characteristics of the curve:
◼
Heating Phase: At the beginning of the roasting process, the temperature increases rapidly, indicating the initial heating of the coffee beans.
◼
Onset of Reaction: At a certain point, the temperature reaches a critical point and a chemical reaction known as the Maillard reaction begins. This is a key stage where the characteristic flavors and aromas of roasted coffee develop.
◼
First Crack: During this stage, a cracking sound is heard, indicating the expansion of the beans due to the release of steam and gases. The temperature remains stable or slightly increases during the first crack.
◼
Development Phase: After the first crack, the temperature continues to gradually increase. In this phase, flavors and aromas further develop, and their intensity depends on the duration of this stage.
◼
Second Crack (optional): In some cases, especially for darker roasts, a second crack may occur. This crack indicates the carbonization of the beans and the formation of oils on the surface.
The shape and duration of each stage in the roasting curve can vary depending on various factors such as coffee variety, desired roasting profile, and equipment used . Analyzing and understanding the roasting curve is essential for coffee roasters as it allows them to control and adjust the roasting process to achieve specific flavor profiles and obtain the desired quality in the roasted coffee .
How do you get the data?
How do you get the data?
Real data from the coffee roasting curve provided by a coffee quality assurance expert⁽¹⁾ was used. These data include information on the time and temperature of the coffee beans, in CSV format. By using real data, the analysis and understanding of the coffee roasting curve become more accurate and reliable.The use of real data from the roasting process offers several advantages. Firstly, it ensures that the analysis is based on real-world scenarios and conditions, making the results more applicable to practical coffee roasting situations. Secondly, it allows for a more precise evaluation of the different stages of the roasting process, as the data reflects actual temperature changes over time. This helps identify specific points such as the first crack, second crack (if applicable), and the development phase, as well as understanding their duration and intensity.To obtain the data, it is necessary to have roasting curve software and industrial instruments such as temperature sensors to perform the most precise measurements in contact with the coffee beans.Having access to real data from the coffee roasting curve also allows for comparisons and establishing benchmarks. Roasters can compare their own roasting curves with the provided data, identifying any variations or deviations and making adjustments as necessary to achieve desired flavor profiles and quality.
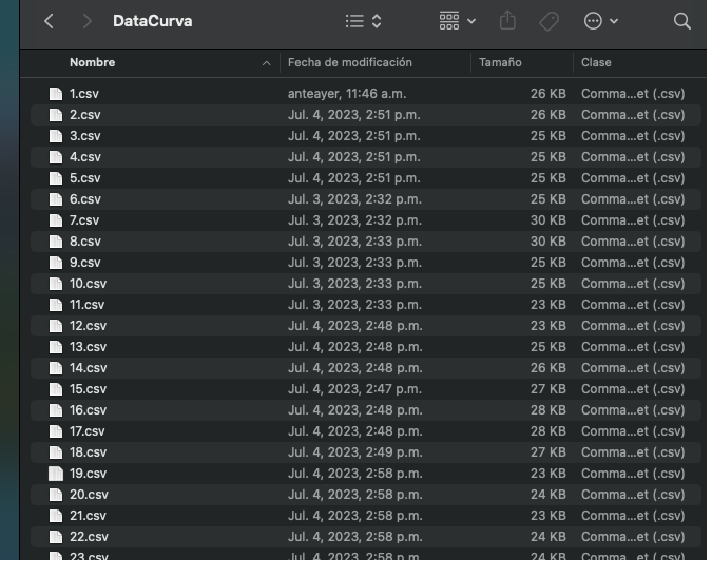
All data files can be downloaded here https://drive.google.com/drive/folders/1ej4B4QUacHFkVzmqqNmF7CzN1Qu5pW6L?usp=sharing
⁽¹⁾See Acknowledgments section
Data processing
Data processing
Load the CVS file
In[]:=
rawData=Import[FileNameJoin[{NotebookDirectory[],"DataCurva","1.csv"}]];
Visualize the data
In[]:=
Grid[rawData,FrameAll,Spacings{1,1},FrameStyleLightGray]
Extract the time and bean temperature
In[]:=
beanTempData=Most[Drop[rawData[[All,{1,6}]],3]];
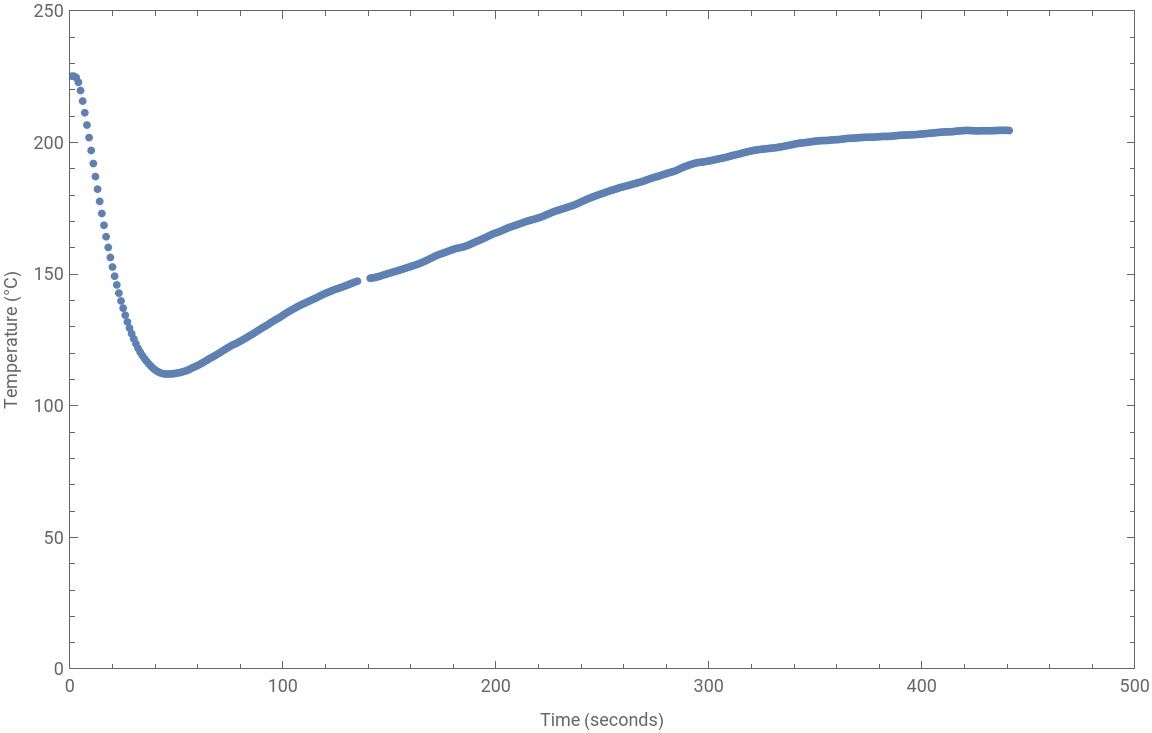
Make a plot of the coffee bean temperature curve
In[]:=
ListPlot[{beanTempData},PlotRange->{{0,500},{0,250}},ImageSize->Large,FrameLabel->{"Time (seconds)","Temperature (°C)"},Frame->True]
Out[]=
Function Manipulate
In[]:=
rawCurveDataFiles=FileNames["*.csv",FileNameJoin[{NotebookDirectory[],"DataCurva"}]];
In[]:=
Manipulate[ListPlot[Most[Drop[Import[rawCurveDataFiles[[i]]][[All,{1,6}]],3]],PlotLabelToString[i],PlotRange->{{0,500},{0,250}},ImageSize->Large,AxesLabel->{"Time (seconds)","Temperature (°C)"}],{i,1,Length[rawCurveDataFiles],1}]
Show 60 coffee roasting curves
Grid[Partition[Table[ListPlot[Most[Drop[Import[rawCurveDataFiles[[i]]][[All,{1,6}]],3]],PlotLabel->ToString[i],PlotRange->{{0,500},{0,250}},ImageSize->Small,AxesLabel->{"Time","Temperature (°C)"}],{i,1,Length[rawCurveDataFiles]}],4],FrameStyle->LightGray]
Create a text with the bean temperature data to use it as a prompt
In[]:=
StringJoin[Riffle[(Function[u,StringJoin[ToString/@Riffle[u,","]]]/@beanTempData),"\n"]]
Function that takes a file path as an argument and displays the coffee temperature and time data as a string
In[]:=
BeanCSVToString[csv_]:=Module[{rawData,beanTempData},rawData=Import[csv];beanTempData=Most[Drop[rawData[[All,{1,6}]],3]];StringJoin[Riffle[(Function[u,StringJoin[ToString/@Riffle[u,","]]]/@beanTempData),"\n"]]]
In[]:=
BeanCSVToString[FileNameJoin[{NotebookDirectory[],"DataCurva","1.csv"}]]
Using GPT models
Using GPT models
Configuration
Configuration
Note: An OpenAI API key is required for this section. 13.3
In[]:=
CoffeeRoastingAnalyze=LLMFunction["You are a helpful assistant who will help me analyze data from a coffee roasting curve as if you were a specialized barista.In addition, roasting curves can help identify and analyze the phases that coffee undergoes during the roasting process, such as the drying phase, Maillard phase, and development phase. The duration of each phase can influence the flavor of the coffee. For example, the duration of the drying phase will affect its acidity and body, while the duration of the Maillard phase will influence sweetness and caramelization. Roasting curves also record whether sufficient heat is applied during each phase of the roasting process.The time that coffee spends in the development phase, the final stage of roasting after the first crack, has a noticeable influence on caramelization, acidity, sweetness, and overall flavors. The shorter the time, the brighter and less caramelized the flavors can be. Conversely, the longer the time, the flavors can appear more \"developed\" or browned, caramelized, and less bright. Providing me with insights into the coffee development. I will provide you with the details in CSV format, where the first column represents time in seconds and the second column represents temperature in Celsius. The curve is `1`: "]
Out[]=
LLMFunction

Curve analysis
Curve analysis
In[]:=
BeanLLM[BeanCSVToString[FileNameJoin[{NotebookDirectory[],"DataCurva","1.csv"}]]]
Out[]=
Based on the provided data, we can analyze the coffee roasting curve as follows:1. Drying Phase: The drying phase is the initial stage of the roasting process where moisture is removed from the coffee beans. In this phase, the temperature gradually increases. From the data, we can see that the temperature starts at 225.18°C and decreases to 152.68°C over a period of 21 seconds.2. Maillard Phase: The Maillard phase is the stage where the coffee beans undergo chemical reactions that result in the development of flavors and aromas. This phase is characterized by the browning and caramelization of the beans. In the provided data, the Maillard phase starts at 152.68°C and ends at 112.33°C, lasting for approximately 24 seconds.3. Development Phase: The development phase is the final stage of roasting after the first crack. It is during this phase that the flavors of the coffee are further developed and intensified. The duration of this phase can greatly influence the overall flavor profile of the coffee. In the provided data, the development phase starts at 112.33°C and continues until the end of the curve at 441 seconds. The temperature gradually increases during this phase, indicating that the coffee is being roasted further.Based on the duration of the development phase, we can expect the coffee to have a well-developed flavor profile with caramelized and browned notes. The longer the coffee spends in this phase, the more pronounced these flavors will be. However, it is important to note that the specific flavors and characteristics of the coffee can also be influenced by other factors such as the origin of the beans and the specific roasting techniques used.
Function evaluation
Function evaluation
Concluding remarks
Concluding remarks
The analysis of the coffee curve has been developed using GPT models, allowing for obtaining precise details about the different phases of roasting at their respective times. This technology has proven to be a powerful tool in studying the roasting curve, providing detailed information about the initial heating, onset of the reaction, first crack, development phase, and in some cases, the second crack.
Furthermore, the use of GPT models has streamlined the process of analyzing the coffee curve, reducing the time required to obtain significant results. This has enabled roasters to save time in evaluating multiple roasting curves and has provided them with greater efficiency in decision-making.
Furthermore, the use of GPT models has streamlined the process of analyzing the coffee curve, reducing the time required to obtain significant results. This has enabled roasters to save time in evaluating multiple roasting curves and has provided them with greater efficiency in decision-making.
Future Work
Future Work
The project can be improved to analyze multiple curves simultaneously, as well as to develop a list of roasting profiles to associate with each curve and have the function determine which roasting profile it belongs to, known as one - shot learning . Additionally, it can be enhanced by adding an interface to obtain real - time data from a coffee roasting machine, storing the data, and analyzing it in real - time.
Acknowledgements
Acknowledgements
Special thanks to :
Carina Barreda for taking the time to gather 60 different real datasets from coffee roasting processes.
My mentor Christian Pasquel and Daniel Sanchez for his help and collaboration in carrying out this project.
Carina Barreda for taking the time to gather 60 different real datasets from coffee roasting processes.
My mentor Christian Pasquel and Daniel Sanchez for his help and collaboration in carrying out this project.
Keywords
Keywords
◼
Coffee
◼
GPT models
◼
Curve Analysis
◼
LLM functions
CITE THIS NOTEBOOK
CITE THIS NOTEBOOK
Coffee roasting curve analysis
by Ivan Prado López
Wolfram Community, STAFF PICKS, July 12, 2023
https://community.wolfram.com/groups/-/m/t/2957551
by Ivan Prado López
Wolfram Community, STAFF PICKS, July 12, 2023
https://community.wolfram.com/groups/-/m/t/2957551