Temperature-Composition Diagram for Immiscible Liquids
Temperature-Composition Diagram for Immiscible Liquids


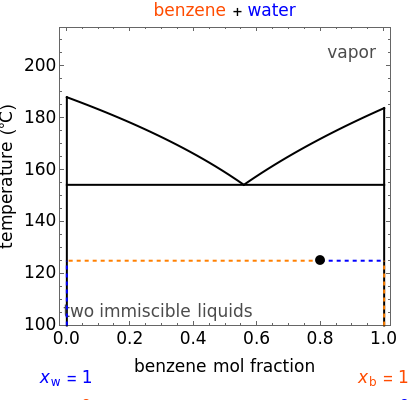
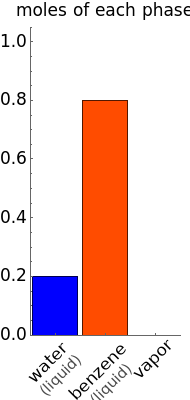
The temperature-composition phase diagram for two immiscible liquids, benzene and water, is at constant pressure. Set the pressure with a slider to change the saturation temperature. Set the overall benzene mole fraction with its slider. The bar graph shows the moles of liquid water (blue), liquid benzene (orange) and vapor (green), which contain both components. The system contains one mole total. You can add heat to change the temperature and the amounts in each phase. At a given pressure, all three phases co-exist at only one temperature. When heat is added at this temperature, one of the liquid phases completely evaporates before the temperature increases.
Details
Details
The pressure of the vapor above two immiscible liquids, benzene and water, is the sum of the individual saturation pressures (benzene) and (water):
P
sat
P
b
sat
P
w
P=+
sat
P
b
sat
P
w
The Antoine equation is used to calculate the saturation pressures:
sat
P
i
A
i
B
i
T+
C
i
where , , and are Antoine constants for component , and is temperature (°C).
A
i
B
i
C
i
i=b,w
T
The dew point curves for the two liquids can be found by solving the following equations for temperature.
For conditions where liquid water is present:
sat
P
b
y
b
and for conditions where liquid benzene is present:
sat
P
w
y
w
where and are the vapor mole fractions for benzene and water.
y
b
y
w
The screencast video at[1] explains how to use this Demonstration.
References
References
[1] Temperature-Composition Diagram for Immiscible Liquids. www.colorado.edu/learncheme/thermodynamics/TxyImmiscibleLiquids.html.
External Links
External Links
Permanent Citation
Permanent Citation
Rachael L. Baumann, John L. Falconer, Derek M. Machalek, Garrison J. Vigil
"Temperature-Composition Diagram for Immiscible Liquids"
http://demonstrations.wolfram.com/TemperatureCompositionDiagramForImmiscibleLiquids/
Wolfram Demonstrations Project
Published: April 17, 2015