Bragg peak instrumental function: X-ray powder diffraction in education
by Robert Dinnebier
This is the second part of three-part series for this work.
First part: https://community.wolfram.com/groups/-/m/t/2408912
Third part: https://community.wolfram.com/groups/-/m/t/2409873
by Robert Dinnebier
This is the second part of three-part series for this work.
First part: https://community.wolfram.com/groups/-/m/t/2408912
Third part: https://community.wolfram.com/groups/-/m/t/2409873
ABSTRACT: A collection of scholarly scripts dealing with the mathematics and physics of peak profile functions in X-ray powder diffraction has been written using the Wolfram language in Mathematica. Common distribution functions, the concept of convolution in real and Fourier space, instrumental aberrations and microstructural effects are visualized in an interactive manner and explained in detail. The corresponding paper is the first part of a series dealing with the mathematical description of powder diffraction patterns for teaching and education purposes.
The following script deals with the semi-empirical Voigt- and Pseudo-Voigt function as it is used for describing the instrumental function of the powder diffractometer.
The following script deals with the semi-empirical Voigt- and Pseudo-Voigt function as it is used for describing the instrumental function of the powder diffractometer.
Voigt & Pseudo-Voigt profiles
Voigt & Pseudo-Voigt profiles
ClearAll["Global`*"];
The following .m file and the notebook that generates it are attached at the end of this post.
Get["Voigt_functions_general.m"]
Out[]=
{FourierParameters{0,1}}
Comparison of Voigt with Pseudo-Voigt distributions
Comparison of Voigt with Pseudo-Voigt distributions
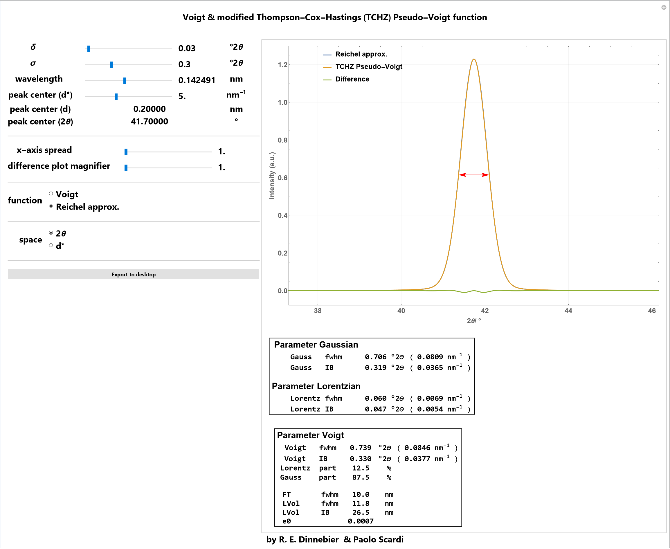
Comparison of the pure Voigt profile, the Reichel approximation and the Thompson-Cox-Hastings (TCH)-Pseudo-Voigt profile for a given Gaussian standard deviation and Lorentzian hwhm in 2θ or d* space. Values for crystallite size and microstrain were calculated under the assumption that the entire width of the peak is caused by either one.
Code
Code
Interface (interactive version in the attached notebook)
Interface (interactive version in the attached notebook)
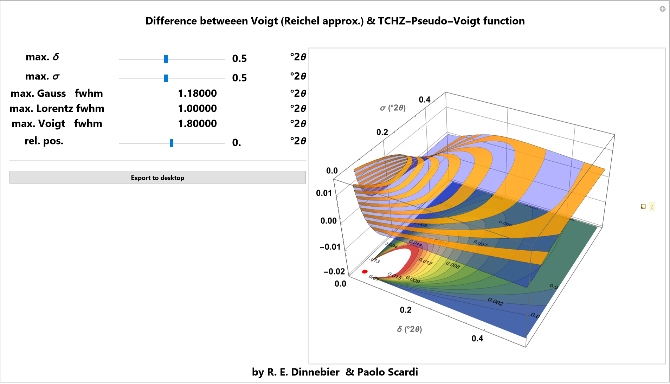
Comparison of Voigt with TCH-Pseudo-Voigt distributions in 3D (maximum deviation at the peak centre in dependence on sigma and delta)
Comparison of Voigt with TCH-Pseudo-Voigt distributions in 3D (maximum deviation at the peak centre in dependence on sigma and delta)
Comparison of the Reichel approximation of the Voigt function with the TCH-Pseudo-Voigt profile as a function of Gaussian standard deviation and Lorentzian hwhm at a given position relative to the peak centre in 3-D.
Code
Code
Interface (interactive version in the attached notebook)
Interface (interactive version in the attached notebook)
In[]:=
Reliability of TCHZ PseudoVoigt fitting
Reliability of TCHZ PseudoVoigt fitting
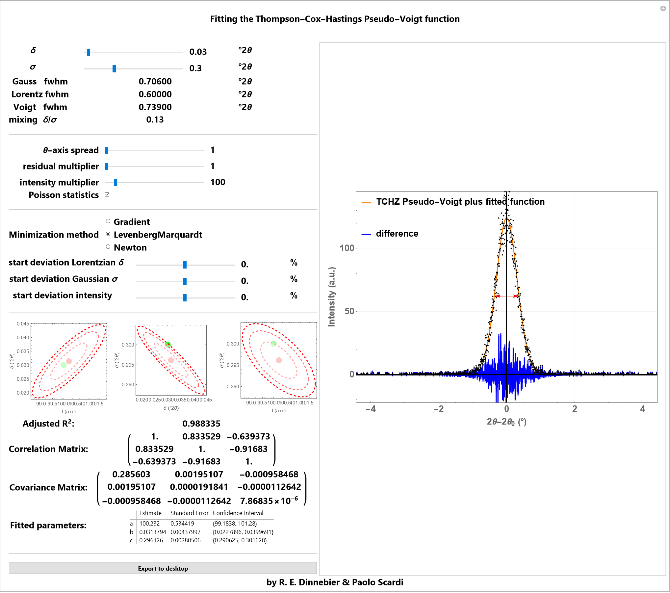
Visualisation of least squares fitting using different algorithms of the TCH-Pseudo-Voigt perturbed by Poisson noise.
Code
Code
Interface (interactive version in the attached notebook)
Interface (interactive version in the attached notebook)
Angular dependence of TCHZ PseudoVoigt
Angular dependence of TCHZ PseudoVoigt
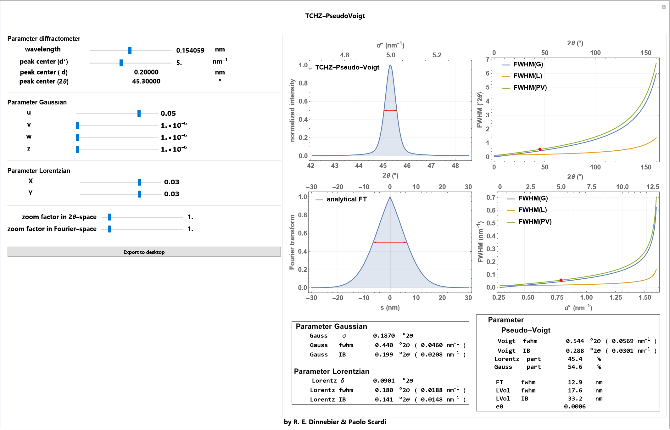
Visualisation of the dependence of the TCH-Pseudo-Voigt function and its Fourier transform on the diffraction angle. Values for crystallite size and microstrain were calculated under the assumption that the entire width of the peak is caused by either one.
Code
Code
Interface (interactive version in the attached notebook)
Interface (interactive version in the attached notebook)
Fourier transform of simplified PseudoVoigt function
Fourier transform of simplified PseudoVoigt function
Simplified Pseudo-Voigt function (left) and its analytical and numerical Fourier transform (right).
Code
Code
Interface (interactive version in the attached notebook)
Interface (interactive version in the attached notebook)
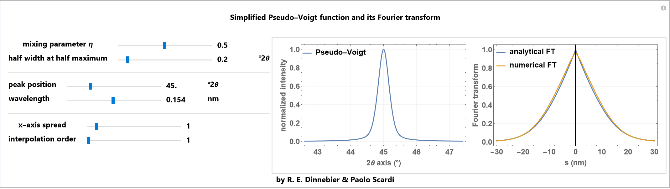
Fourier transform of Voigt function
Fourier transform of Voigt function
Voigt function (left) and its analytical and numerical Fourier transform (right).
Interface (interactive version in the attached notebook)
Interface (interactive version in the attached notebook)
Plot of the fwhm of the TCH-Pseudo-Voigt function as a function of the fwhm’s of the Gaussian and the Lorentzian part (solid lines) and the corresponding integral breadths β (dashed lines).
Series of normalized Gaussians (left) and their corresponding Fourier transforms (right) with different standard deviation σ on a 2θ- and reciprocal 2θ-scale.
Series of normalized Lorentzians (left) and their corresponding real Fourier transforms (right) with different δ (=hwhmL) on a 2θ- and reciprocal 2θ-scale.
Series of normalized Voigt profiles (left) and their corresponding real Fourier transforms (right) with different Gaussian standard deviation σ and Lorentzian hwhm δ on a 2θ- and reciprocal 2θ-scale.
Plot of the error function and the complimentary error function given.