In[]:=
ClearAll["Global`*"]
In[]:=
streak[x_,pAgain_]:=If[x==-1,RandomChoice[{pAgain,1-pAgain}->{-1,1}],RandomChoice[{1-pAgain,pAgain}->{-1,1}]]ht[dep_,n_]:=NestList[streak[#,dep]&,-1,n]randWalkDep[dep_,n_]:=Accumulate[NestList[streak[#,dep]&,-1,n]]streakBball[x_,pScore_,dep_]:=If[x=="score",RandomChoice[{pScore-dep,1-pScore+dep}->{"score","empty"}],RandomChoice[{1-pAgain,pAgain}->{-1,1}]]
In[]:=
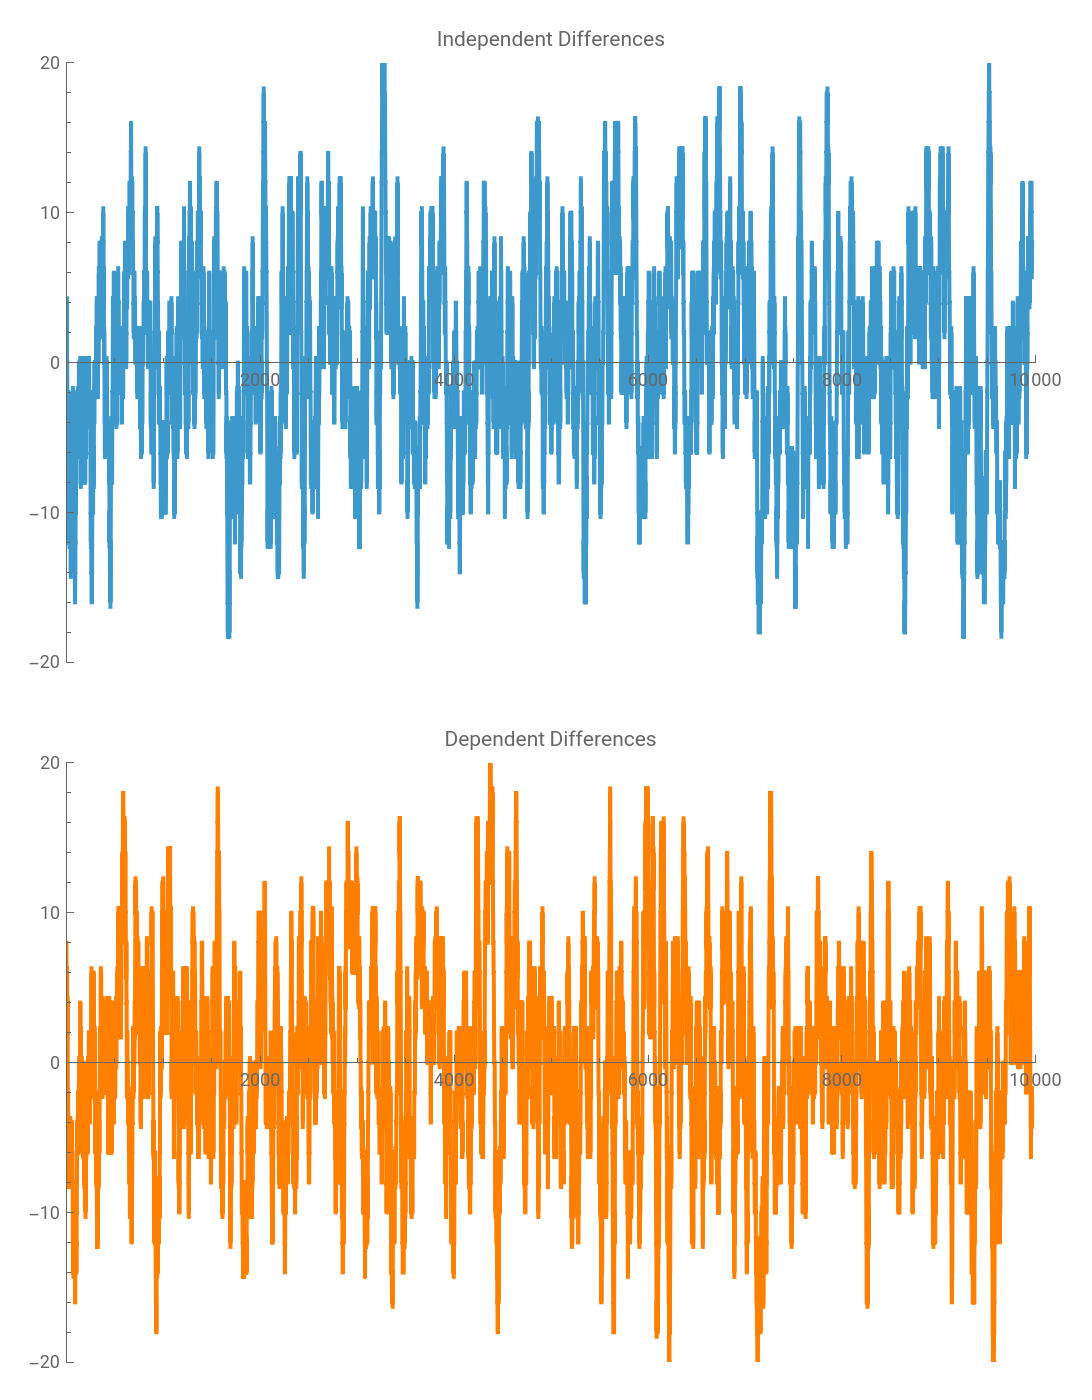
Manipulate[Module[{medioc,extrem},medioc=randWalkDep[0.5,10000];extrem=randWalkDep[dep,10000];GraphicsColumn[{ListLinePlot[Differences[medioc,d,differenceWindow],PlotRange->{{0,10000},{plotrange,-plotrange}},PlotLabel->"Independent Differences"],ListLinePlot[Differences[extrem,d,differenceWindow],PlotRange->{{0,10000},{plotrange,-plotrange}},PlotStyle->Orange,PlotLabel->"Dependent Differences"]}]],{{dep,0.525,"dependent_p"},0.1,0.9,0.025},{{d,1,"nth derivative"},1,10,1},{{differenceWindow,40},1,50,1},{{plotrange,20},2,1000,5},SynchronousUpdating->False,SaveDefinitions->True]
Out[]=


In[]:=
getIndependentandDependent[n_,pDep_:.5,chunkSize_:1000,nChunks_:10]:=Module[{pairings,med,ext,medTwos1,medTwos2,medTwos,extTwos1,extTwos2,extTwos},pairings={};Do[med=Table[ht[0.5,chunkSize],nChunks];ext=Table[ht[pDep,chunkSize],nChunks];medTwos1=Map[SequenceCount[#,{1,1},Overlaps->True]&,med];medTwos2=Map[SequenceCount[#,{-1,-1},Overlaps->True]&,med];medTwos=medTwos1+medTwos2;extTwos1=Map[SequenceCount[#,{1,1},Overlaps->True]&,ext];extTwos2=Map[SequenceCount[#,{-1,-1},Overlaps->True]&,ext];extTwos=extTwos1+extTwos2;AppendTo[pairings,{medTwos,extTwos}],n];MapApply[RandomSample[{{#1,"Independent"},{#2,If[pDep==0.5,"Independent","Dependent"]}}]&,pairings]]
In[]:=
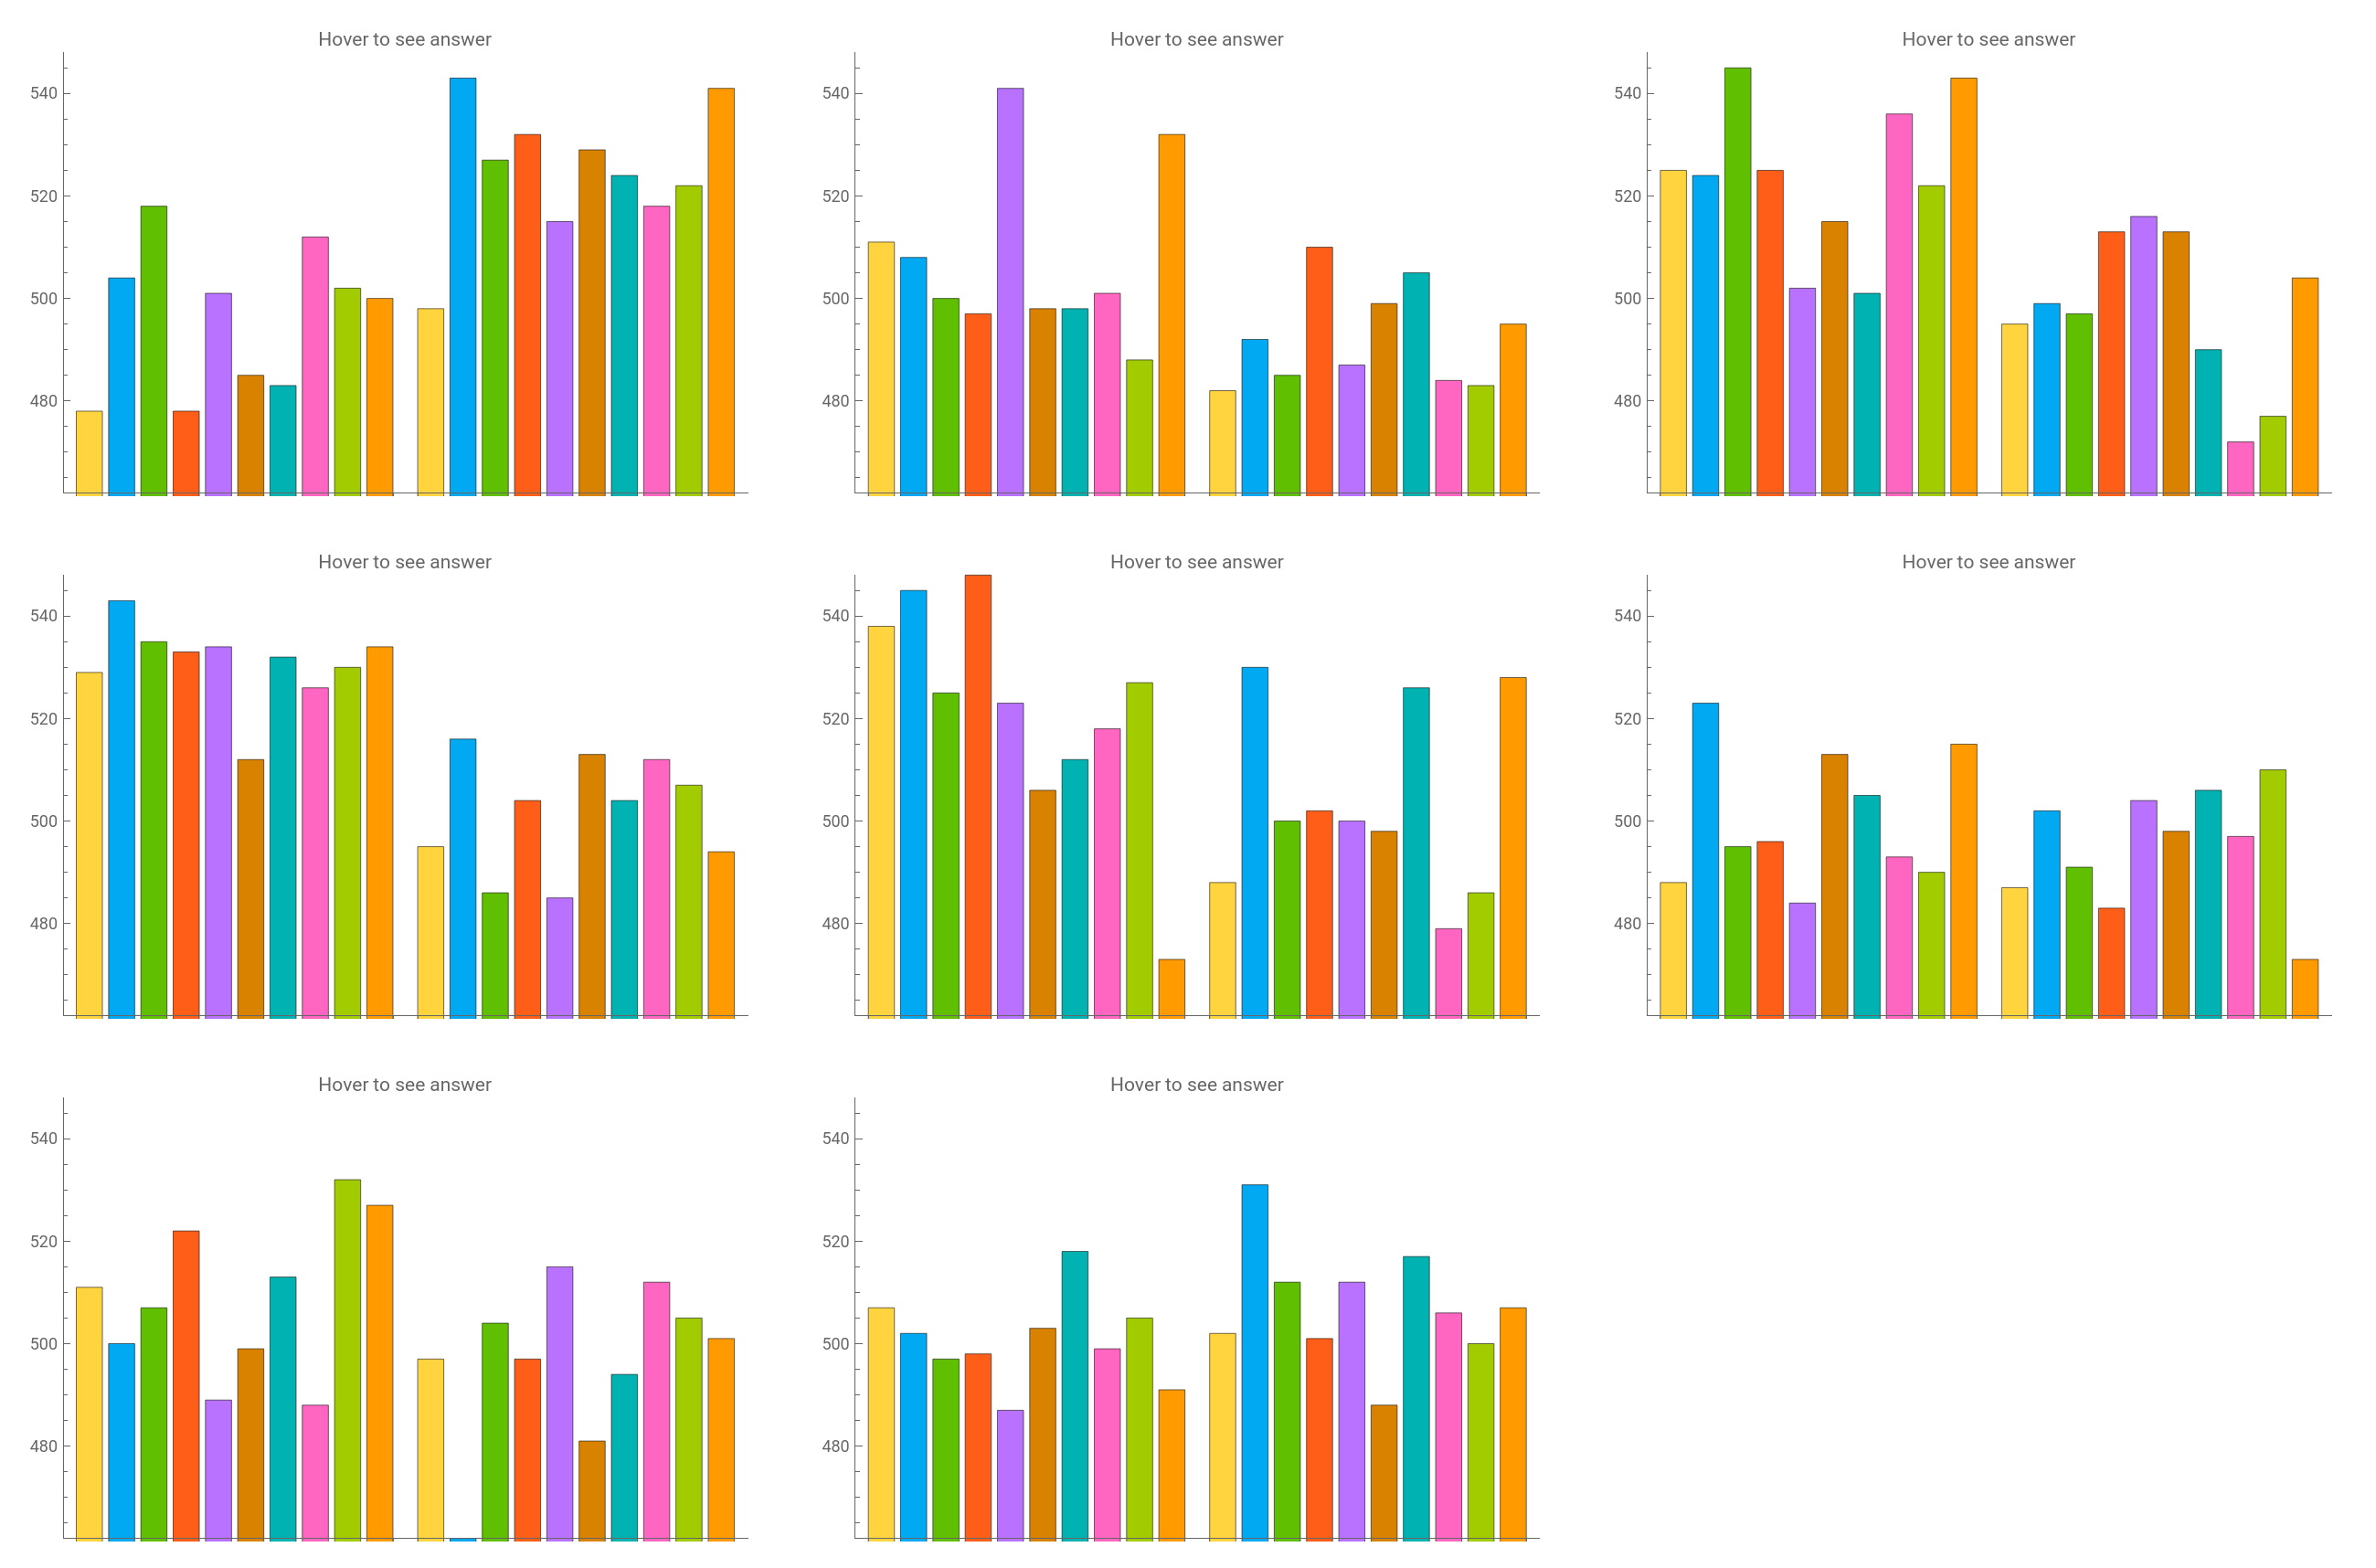
Manipulate[Module[{ext,med,chartsMed,chartsExt,testCharts,allData},ext=getIndependentandDependent[Ceiling[nCharts/2],pDep,chunkSize,nChunks];med=getIndependentandDependent[Floor[nCharts/2],.5,chunkSize,nChunks];allData=Map[#[[1]]&,Join[ext,med],{2}];chartsExt=BarChart[{#1[[1]],#2[[1]]},PlotRange->{Min[allData],Max[allData]},PlotLabel->Tooltip["Hover to see answer",#1[[2]]<>", "<>#2[[2]]]]&@@@ext;chartsMed=BarChart[{#1[[1]],#2[[1]]},PlotRange->{Min[allData],Max[allData]},PlotLabel->Tooltip["Hover to see answer",#1[[2]]<>", "<>#2[[2]]]]&@@@med;testCharts=RandomSample[Join[chartsExt,chartsMed]];GraphicsGrid[Partition[testCharts,UpTo[Ceiling[Sqrt[nCharts]]]],ImageSize->1300]],{{nCharts,8},8,25},{{pDep,0.525},0,1,.025},{{chunkSize,1000},100,10000,100},{{nChunks,10},2,30,2},SaveDefinitions->True]
Out[]=